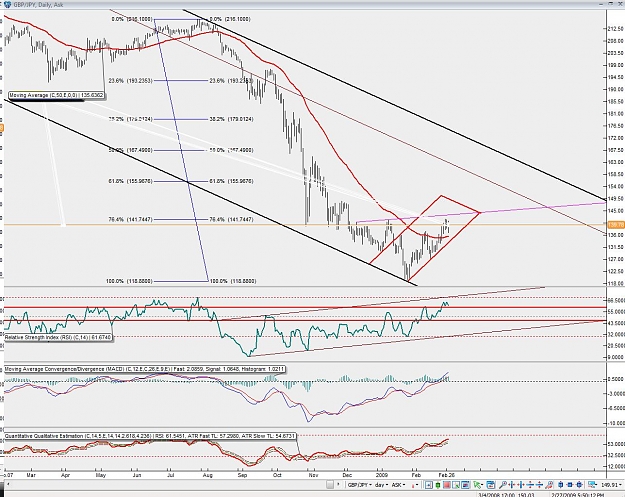
I will sell from pink lines as many times it hits it.. and cash it whenever price touches bottom pink line.. if price breaks higher than TOP pink line .. will sell again ..as this bear flag should continue a bit higher.. This looks like a huge Bear Flag..... I think we will see a 2 week long range here.. Buying would be nice around 124xx area... target 155xx area.
Joined Apr 2007
|
Status: "As Above So Below"
|6,206 Posts
A 4hr view with levels that will be bought by or before EOD monday
a buy day means they may run prices higher and sell it off quickly driving price to los where they will buy again for a 2 day rally after this decline finishing a 3 day cycle
Attached Image (click to enlarge)
"Millionaires don't use astrology, billionaires do"
A 4hr view with levels that will be bought by or before EOD monday
a buy day means they may run prices higher and sell it off quickly driving price to los where they will buy again for a 2 day rally after this decline finishing a 3 day cycle
Hi Forexlion,
How are you? I have a off the topic question and wanted to seek your advice or anybody's in this regard............I have a 2 internet Firewalls , I use them alternately , still I see on logs Microsoft -SQL-monitor ,TCP 7212, UDP 1026,TCP 9090 nuisance intrusions...........Could you propose a way to stop such intrusions if possible?
Thanking you in advance and all
Happy piping
quote=forexlion;2570810]
File >> Save as picture
Active chart (as is)
The end result will be a complete chart as shown below.
I do agree with the pullback for several days before the rally toward a higher level.
The overall trend is bullish and pullbacks is mainly supply and demand..
Double top this past week indicated a pullback before another rally to break thru the 141.50 zone which will set a higher level for this year..
Chopping it way thru the negative bias to retrace back to the 50% level.
Ignored
Well like anything its just another tool, The market cpsychology is sound though, 3 day cycles very much real. the psychology of that cycle seems to fit very well, the projections all last week have been spot on except for the first or second day of the week where we actually blew through the top side targets of the moving average project. not so rare but knowing such a things also tells something, within the cycle at play CONTRACTION. So it was a sure sell last week and sure enough it played out just like that, Buy days are generally a run up in price with a sharp sell off. where they will accumulate positions for the next cycle, the sell day is a balancing of that buy day buying as price will generally rise and the sell short day is the end of that cycle where they wuill rally the market to the offers and liquidate the end of that cycle into the buying. And the cycle starts again
I suspect they may gap through the top catching the stops and sell into the rally for a sharp decline, whether they are still bullish will determine the depth of decline. From daily perspective im seeing a slow down in that setiment for now. But who knows shake the dice
"Millionaires don't use astrology, billionaires do"
The three day cycle seems to fit into the setup before thursday GU rate decision which will help support the breakout in three days on thursday. Most of the time the PA is priced in before the big announcement for major news .
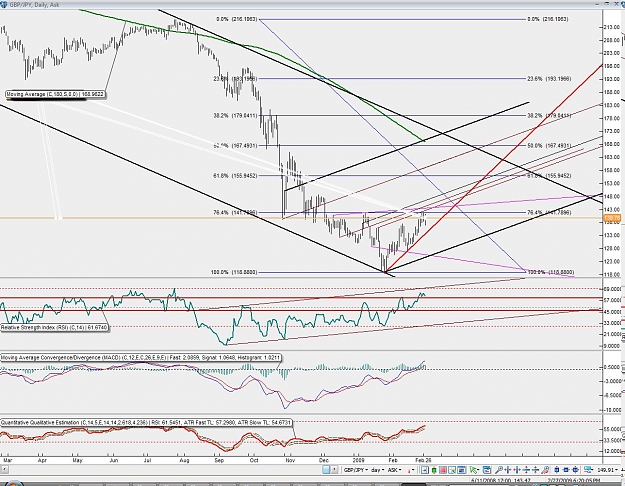
GJ is in a wedge and it will consolidate until some major news come out to break the cycle.. The overall lower TL will be test again as well as 50ema on the daily chart
The three day cycle seems to fit into the setup before thursday GU rate decision which will help support the breakout in three days on thursday. Most of the time the PA is priced in before the big announcement for major news .
GJ is in a wedge and it will consolidate until some major news come out to break the cycle.. The overall lower TL will be test again as well as 50ema on the daily chart
Ignored
Thanks alot for ur analysis... I belive gu going down..Its now 139.2 and its low 138.62
Thanks alot for ur analysis... I belive gu going down..Its now 139.2 and its low 138.62
Ignored
ever notice that what ever the gap direction is on A Sunday the rest of the week we head in the opposite direction . I was looking for a small gap down under low volume to confirm a market test,
there is a massive amount of buyers sitting at 137 right now , we had a climatic action there on Friday as buyers swamped the seller. , so we have strong support at this level
anything could happen as there does seem to be bearish div on a 4 hour rsx and could be a bear flag on 60 min, but right now unless 135 is taken out ever dip is being met by buyers .... that is very clear from the 60 min charts. It is still buy dips .
We may be headed down this week. Daily chart shows a tweezer top, price rejected at 141.50 area 3 times, with last Friday being a hanging man and also a Harami pattern... Seems to all point down IMHO.
ever notice that what ever the gap direction is on A Sunday the rest of the week we head in the opposite direction . I was looking for a small gap down under low volume to confirm a market test,
there is a massive amount of buyers sitting at 137 right now , we had a climatic action there on Friday as buyers swamped the seller. , so we have strong support at this level
anything could happen as there does seem to be bearish div on a 4 hour rsx and could be a bear flag on 60 min, but right now unless 135 is taken out ever dip is being met by buyers...
Ignored
thanks for ur expectations...but i still belive gu going dowen and it will breake 130.6 within the coming 2 days for a couple of reasons:
- usdjpy make a full up till the resistant point 98.6 and its goung to a correction 93.6 at least.
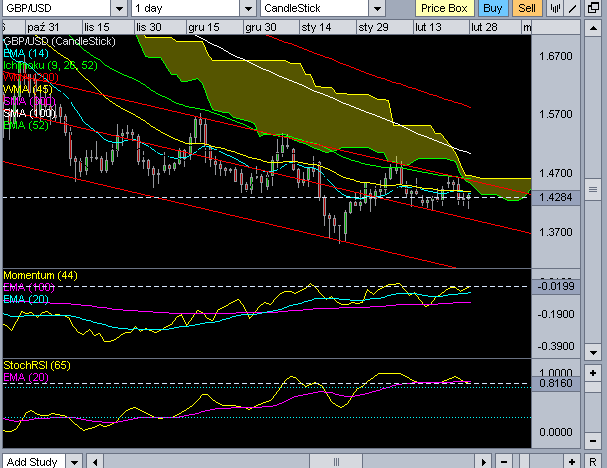
-gbpusd make a full up to 1.466 which mean this point will sliddown to 1.383 and if its broken it will test 1.356 again.
thanks for ur expectations...but i still belive gu going dowen and it will breake 130.6 within the coming 2 days for a couple of reasons:
- usdjpy make a full up till the resistant point 98.6 and its goung to a correction 93.6 at least.
-gbpusd make a full up to 1.466 which mean this point will sliddown to 1.383 and if its broken it will test 1.356 again.
Ignored
uj major selling vol at 98 for now
However the Friday move up of gu did show some buying , but we have been in a down trend since 23rd.
The gj has buyers at 137 . I would be happier selling rallies once we have a 4 hour close under that
Other than resistance not breaking at 141.50 the gj could do anything and if we do get a break of 141.50 right now it has to be very impulsive with a move thru 143 very quickly on high vol.
if the move is in Asia during low vol I expect it will be a trap.
I just play one day at a time and find trading intraday , even from a 15 min chart is better than trading on higher time frames due to the ranging market we have right now.
does that look like a rounded bottom forming on the daily chart? Also a rising wedge on the four hour? My simple method of looking for where the price may go..
I think we might be going up, 150.xx area.. Though not straight away of course.
Or i could be totally wrong.. Anway, closed my short over the weekend from 140.12 for a bonus 60 pips..