Also gator read this PDF from Tom Williams which outlines in further detail the VSA Strategy..Once you have an understanding of how accumulation and distribution you'll see that it becomes second nature..You'll be able to read and even predict, what the smart money will do.How they will mark up the price of EUR/USD and then you can tell when its time to reverse and you can then get on the right side of the trade..This method is amazing and a trader who can understand this can trade with the smart money.
Thanks nyse1982! I really appreciate you taking the time to try to explain VSA! ( however, I am sure I am not done with my gazillion questions that I am sure will arise!) Thanks again!
Also gator read this PDF from Tom Williams which outlines in further detail the VSA Strategy..Once you have an understanding of how accumulation and distribution you'll see that it becomes second nature..You'll be able to read and even predict, what the smart money will do.How they will mark up the price of EUR/USD and then you can tell when its time to reverse and you can then get on the right side of the trade..This method is amazing and a trader who can understand this can trade with the smart money.
Ignored
I have read most of this PDF but, over this weekend I will read it again...
Also gator read this PDF from Tom Williams which outlines in further detail the VSA Strategy..Once you have an understanding of how accumulation and distribution you'll see that it becomes second nature..You'll be able to read and even predict, what the smart money will do.How they will mark up the price of EUR/USD and then you can tell when its time to reverse and you can then get on the right side of the trade..This method is amazing and a trader who can understand this can trade with the smart money.
Ignored
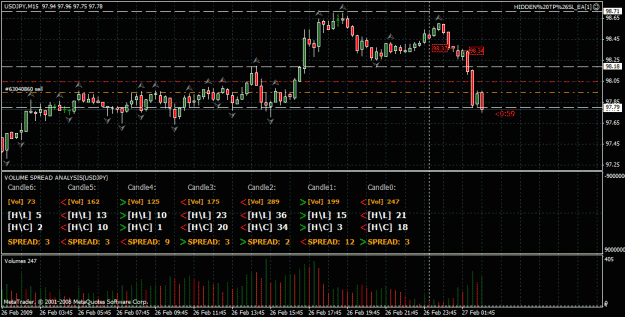
Just went short on USD/JPY based on weak volume 1 which was an up bar.Closed out at 97.78
NYSE1982, I think that there is an outstanding question that still hasn't been answered. According to page 18 of the Master of the Markets Trading guide that you published,
"The price spread is the difference between the highest and lowest trading points reached during the timeframe you are looking at, which may be weekly, daily, hourly, or whatever other timeframe you choose."
The question is why have you chosen to calculate the spread differently than the guide? You are calculating spread as the (high-Low) - (high-close).
Please share why you changed the formula from what is listed in the guide.
|
Joined Sep 2005
|
Status: pip my ride
|507 Posts
What I mean is a graphical representation of the volume/spread relationship to better visualize where to enter long/short instead of showing only volume.
What I mean is a graphical representation of the volume/spread relationship to better visualize where to enter long/short instead of showing only volume.
Ignored
That's what I was suggesting a few posts back... spread shouldbe easy to plot as a graph line, on a scale of 0 to say 50... when the spread line approaches "0" you knowit's getting close to "go time"!
NYSE1982, I think that there is an outstanding question that still hasn't been answered. According to page 18 of the Master of the Markets Trading guide that you published,
"The price spread is the difference between the highest and lowest trading points reached during the timeframe you are looking at, which may be weekly, daily, hourly, or whatever other timeframe you choose."
The question is why have you chosen to calculate the spread differently than the guide? You are calculating spread as the (high-Low) - (high-close).
Please share...
Ignored
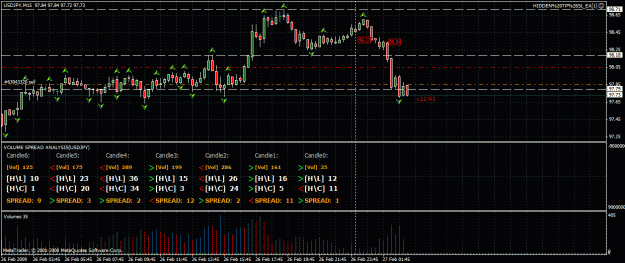
Yes, earlier me and another member were having a discussion and I explained that the formula that I was using is what was researched from SFO as per this article http://www.sfomag.com/homefeaturedet...ne&YearID=2006
VSA looks at the interrelationship between three variables on the chart in order to determine the balance of supply and demand as well as the probable near term direction of the market. These variables are the amount of volume on a price bar, the price spread or range of that bar (do not confuse this with the bid/ask spread), and the closing price on the spread of that bar
That's what I was suggesting a few posts back... spread shouldbe easy to plot as a graph line, on a scale of 0 to say 50... when the spread line approaches "0" you knowit's getting close to "go time"!
Anyway, great work so far, thanks everyone!
Ignored
thats a good point, because this would help us better on when to decide upon a entry point...great idea..
What I mean is a graphical representation of the volume/spread relationship to better visualize where to enter long/short instead of showing only volume.
Ignored
Lets see if we can get another update to this beta...I think were getting real close to refining this strategy.
That's what I was suggesting a few posts back... spread shouldbe easy to plot as a graph line, on a scale of 0 to say 50... when the spread line approaches "0" you knowit's getting close to "go time"!
Great ideas guys can someone mention this to forexflash...I'll be at work from 8am-5pm EST so I don't know that I'll catch him on..but keep me updated once we get this histogram coded.
Sorry guys....why didnt somebody point this out from the begining!
I realy dont have time to code another indicator!
Anyway, all you need to know is in last indicator......or are you to lazy
to watch the numbers?
All I can do is to refine my original indicator, but I dont know
what else to add to it!
What I mean is a graphical representation of the volume/spread relationship to better visualize where to enter long/short instead of showing only volume.
Ignored
I agree, although I'm beginning to see the cause and effects of the spread and volume, I'm really struggling to catch the entries based on the figures alone so a graphical indication would be great!!
I am new to this thread, but have been exploring PA for the past month as I am tired of lagging indicators. I have put together some indicators that might help. One is a histogram of the spread and the other is a histogram of the HL Range.
The coding is poor as I modified another indicator just to get it on my charts, so I only sent the .ex file
Sorry guys....why didnt somebody point this out from the begining!
I realy dont have time to code another indicator!
Anyway, all you need to know is in last indicator......or are you to lazy
to watch the numbers?
All I can do is to refine my original indicator, but I dont know
what else to add to it!
Regards
Ignored
hey thanks for your help, I agree we can work something out..I have no problems choosing an entry based on the numbers, however some of the members are having trouble choosing an entry or exit. So there's suggestions to see if we can come up with a histogram of some sort.
I have no clue however as to how we could create one or what even to base it on. I need some more suggestions, I know for know were using 6 candles so Im assuming if we do create a histogram it should be based on that..