Based on my weekly chart using line graph, I projected a long target near the(76.8 % retracement) 150.00 area... I hope others discover this formation...
can somebody explain to me what does it mean doublw witching nad triple witching hour
Ignored
Quote
Disliked
Triple witching hour is the last hour of the stock market trading session (3:00-4:00 P.M., New York Time) on the third Friday of every March, June, September, and December. Those days are the expiration of three kinds of securities:[list][*]Stock index futures.[*]Stock market index options.[*][url="http://en.wikipedia.org/wiki/Stock_options"]Stock...
I mentioned it looked trappish to me in frankfurt .. large down moves like the impulsive one we had at London open , that stop dead and get buyers are nearly always traps.
draw 14 wma on charts ( blue line) .. this will help ... prices does not dip under it go long only .. look to your 15 min charts for direction . Note how price tried to break the 14 wma a couple of time on the way up . But there was no strength to the selling. This is what i mean by price action
Joined Apr 2007
|
Status: HARD SHYT SCUBA TRADER
|20,886 Posts
4 hour chart 136 is critical ... break out of this we may see that 141 a few have mentioned ... however right now we are at the top of a downtrend channel and 4 hour rsx has turned down
If price moves towards the lower part of the larger channel we see 120 .
There is bearish div on rsx daily
should be an interesting week....will have to see how this plays out , but i favour move down of gj at least to test 130
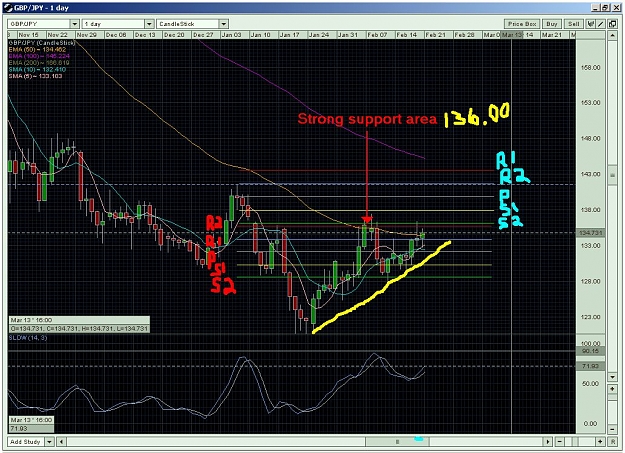
Here is my what I,m seeing on the daily . This coming week could be a wild
one for this pair . It also looks like a flag forming in favor of a down move.
I also see we are entering the over bought zone.with a strong support @ 136.00 if this holds the trend to the downside continues if not and it brakes
we will go up some more like some of you all ready mention.
I have been following this thread for a long time and want to thank all
the senior traders for helping other learn to trade better.
thanks malcolmb, but i guess i still suck at this feeling...
how did u see the 14sma in your charts? would appreciate in your explanations.
Ignored
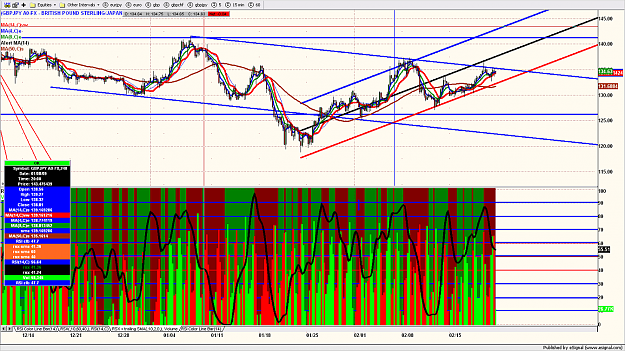
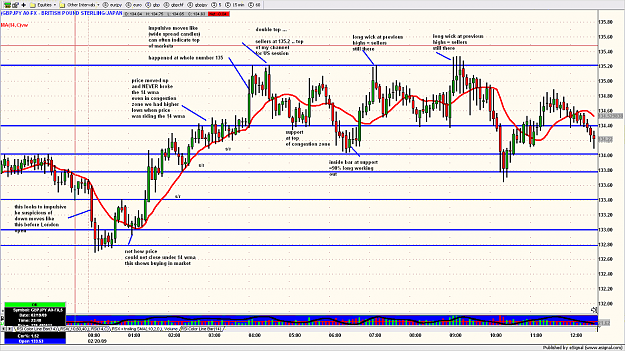
one simple chart ,,,, showing all trades and comments for set ups .. from London session to US session .. not price and one moving average only(14 wma) ... and blue lines are areas of support / resistance
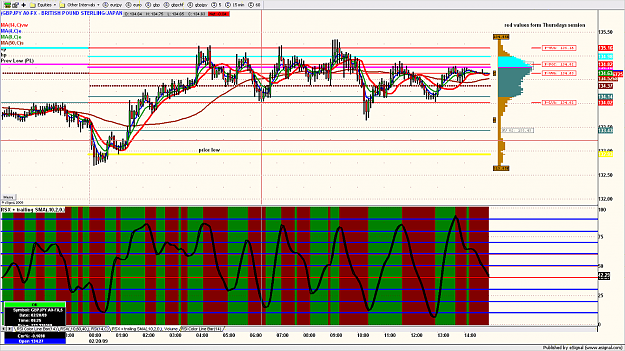
2nd chart ... add back prior low , and volume histogram stuff ....
see how the prior days upper value area , point of control , lower value area are in same zone as Fridays values ... could be topping on daily. If on Sunday we get above 135.20 then test 137 is in order. Note how prior low was also Friday session low.
often all ones needs to trade is simple support and resistance and some candle patterns
one simple chart ,,,, showing all trades and comments for set ups .. from London session to US session .. not price and one moving average only(14 wma) ... and blue lines are areas of support / resistance
2nd chart ... add back prior low , and volume histogram stuff ....
see how the prior days upper value area , point of control , lower value area are in same zone as Fridays values ... could be topping on daily. If on Sunday we get above 135.20 then test 137 is in order. Note how prior low was also Friday session low.
often all ones needs...
Ignored
did you take a look at usdjpy daily chart? that test with average/low volume, i dont think we're going to break higher, do you? and on the weekly chart, i see it looks like a weak up move.
I recommend you read something else as this sentence is now concluded.
did you take a look at usdjpy daily chart? that test with average/low volume, i dont think we're going to break higher, do you? and on the weekly chart, i see it looks like a weak up move.
Ignored
I have a feeling that yen declines will be bought, u may want to follow the smart money when u se them steppiing in
"Millionaires don't use astrology, billionaires do"
did you take a look at usdjpy daily chart? that test with average/low volume, i dont think we're going to break higher, do you? and on the weekly chart, i see it looks like a weak up move.
Ignored
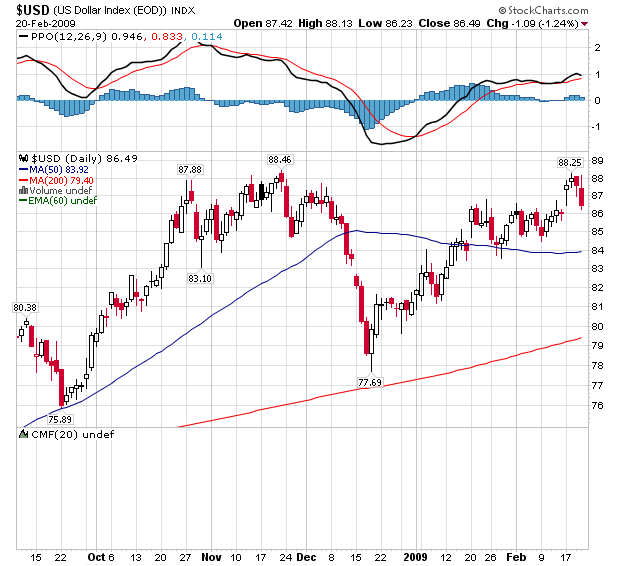
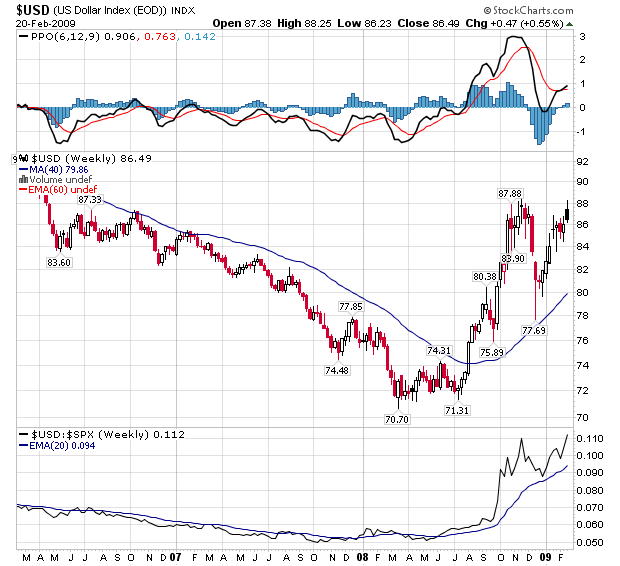
looking usd index .. I see weakness at top here... UJ should head down
GU buying already started, We may see move up in gj , but now it will be coming from gbpusd. Beauty of being a day trader is i do not have to think about these things ... just come to the computer and then see what the price action tells me.
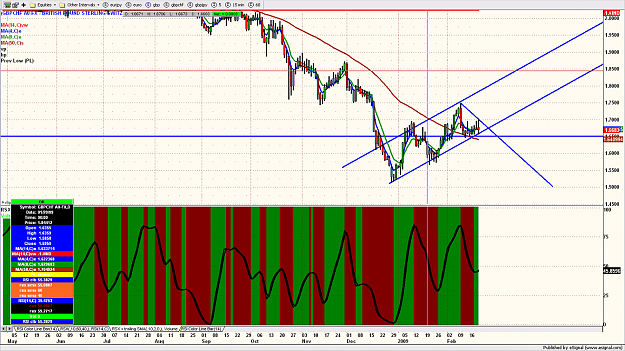
GBPCHF is worth watching .... look very bear flaggish on the daily .. could drop another 1000 pips if the bear flag is broken if it closes under 1,6500 on a daily high chance we will see 1.5500
with gold over 1000 i think we see the push higher in gold , taking chf with it , as the 'retail' buyers are consumed with gold going to 1500 per ounce ....
|
Joined Apr 2008
|
Status: I Was But the Learner
|973 Posts
I agree about gbp/chf . . . a break of Friday's low should produce some pips. How many, no clue. What you seeing on Eur/Usd Malcomb? I want to go long for a swing trade but you can't seem to hold onto anything long in this market before it turns around on you . . .
"Don't trade to trade . . . trade to win." - James16
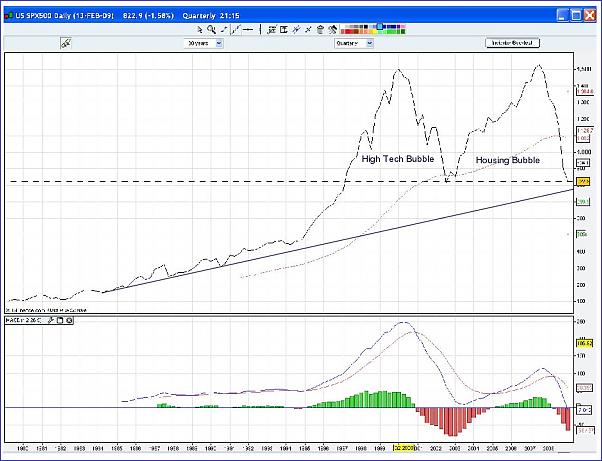
Global macro funds "position" big dollars off changes in perception/outlooks, eg. Soros types. Fri's talk of nationalization of Citi, Bank of America could be secular (ie. long-term) game changer, a big "macro" picture line in the sand stopping USD (DX) at 3 year double/triple top.
Nationalization of those banks a gestalt switch for USD, potentially.
Based on my daily GJ chart, PA seems to stay within the downward channel.
Next week should be interesting...
Good Luck!!!
Ignored
Yes, would only be bullish if a NARROWING downward wedge.
My take from rgitt05's daily GJ chart: bearish or a complex bottom (random expanding and contracting volatility, taking out lows and highs with FALSE breaks, with repeated stop testing, i.e., Victor Sperandeo "2B" type of trades).
I agree about gbp/chf . . . a break of Friday's low should produce some pips. How many, no clue. What you seeing on Eur/Usd Malcomb? I want to go long for a swing trade but you can't seem to hold onto anything long in this market before it turns around on you . . .
Ignored
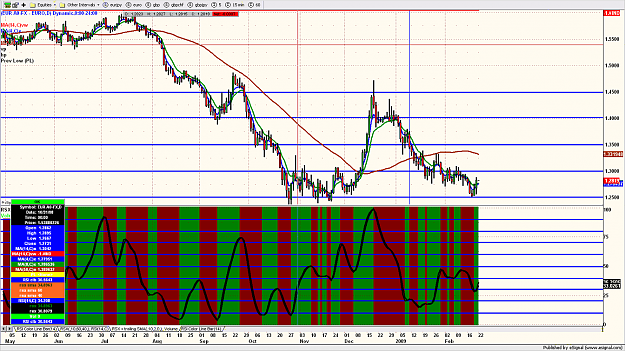
well eurusd I think has found a bottom at 1.2500. It seems to be moving in 500 pip lots on the daily right now , so a break of 1.3000 takes it to 1.3500. The daily rsx has bullish div
If i am in fact seeing a top in the DX right now both eu and gu should both move up about 500 - 1000 pips each
The one mitigating factor in the Yen is how serious is the BOJ in supporting the yen? not much.. rates are low & their econ is slowing and overly export dependent. I'm guessing they have a strong interest in a weaker yen & may intervene if we try and challenge recent lows- lows for the gbp/jpy we set back in '95.