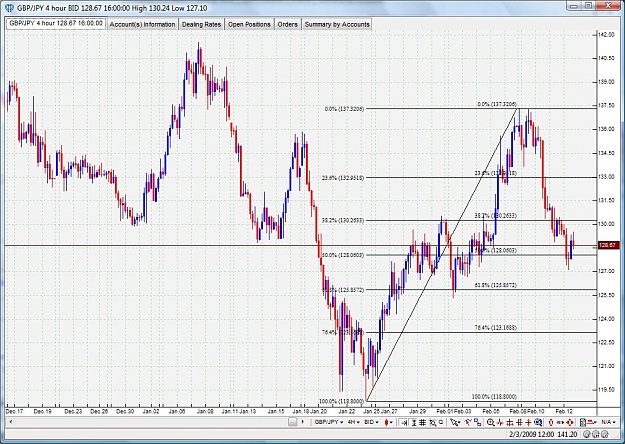
On the fibonacci front, one of the main cycles of interest for intraday traders is on this 4hr chart, while price slowly works its way down to the 61.8 fib (chart #1).
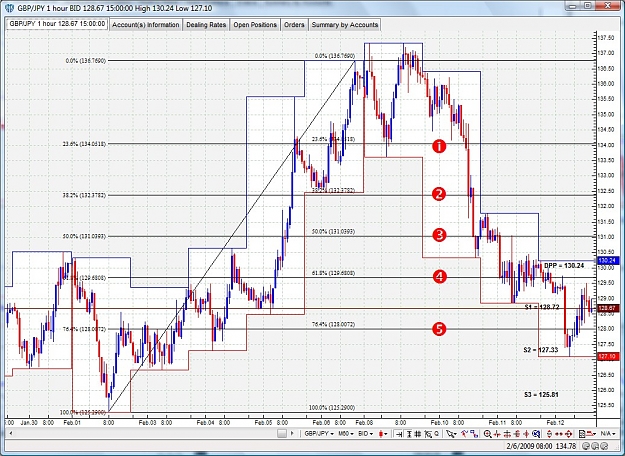
But there’s another important cycle in play on this 1hr chart (chart #2), using last week’s low / high. It shows where price gravitates to, stalls, maybe forms a bear flag, then eventually moves on.
I also put pivots on chart #2. Today’s high was at the DPP, and the low near S2. Price is currently trading near S1. So they’re also important areas of support and resistance.
Attached Image(s) (click to enlarge)