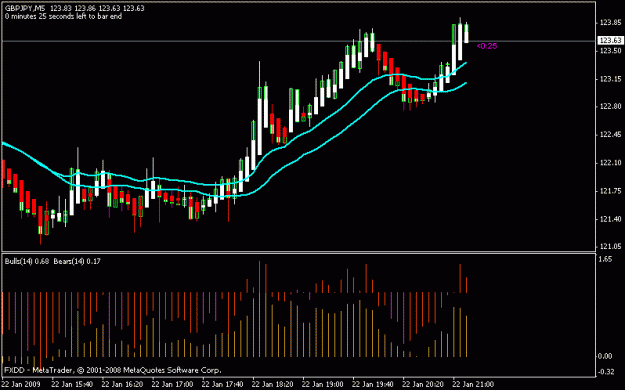
Can you post the screen shot of the EMA setting you are using
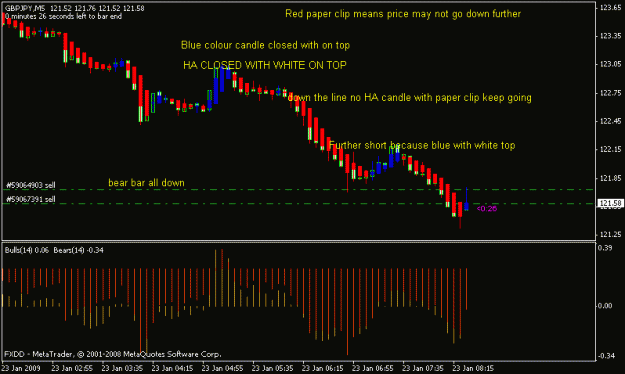
and also the screen shot of the entry you have lost
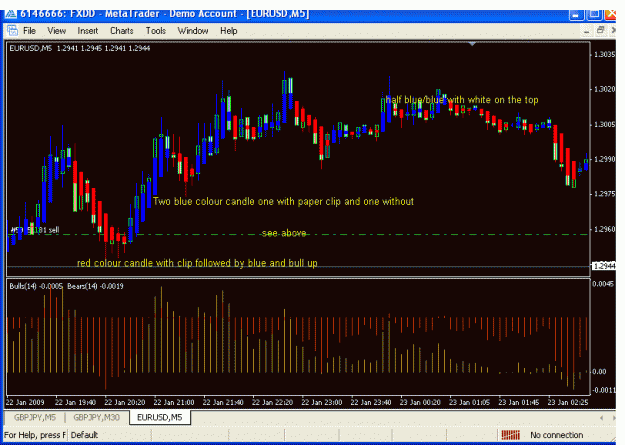
by the way this method is developed by me only and yes lot of time was
put to study the chart etc
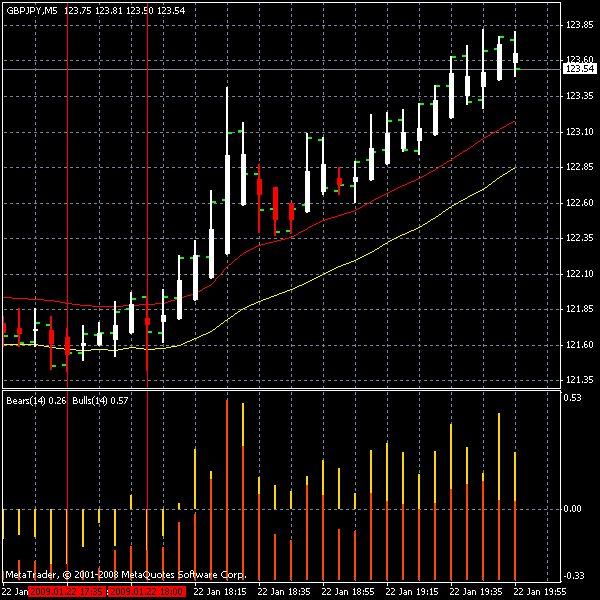
Now I am in the process of studying the entry purely based on heiken ashi
without EMA and any other indicator
and also the screen shot of the entry you have lost
by the way this method is developed by me only and yes lot of time was
put to study the chart etc
Now I am in the process of studying the entry purely based on heiken ashi
without EMA and any other indicator