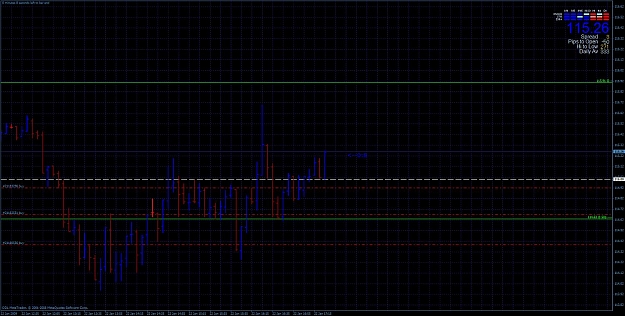
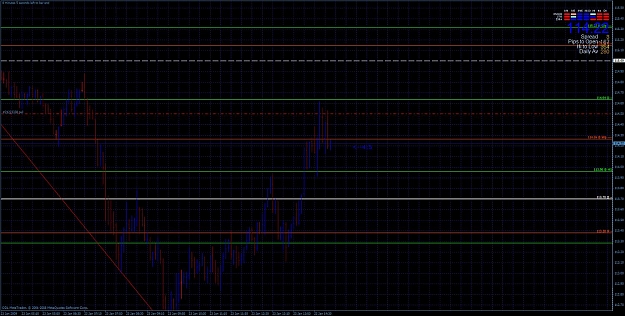
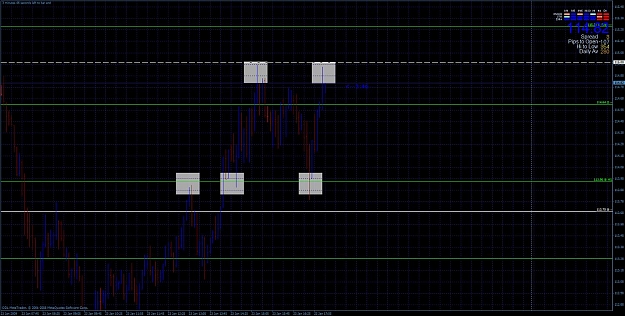
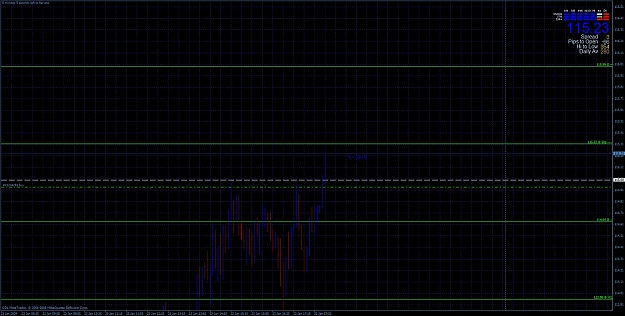
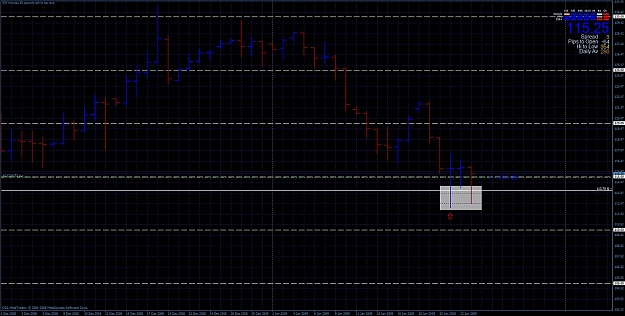
In terms of chart analysis, Japanesse asset managers rely heavily on Ichimoku cloud and candlestick chart system recognition pattern (doji, tweezer tops,...) that highlights trends and major reversals.Due to a specific Japanesse culture and strategy information-sharing, asset managers act in the same direction on the yen in the currency market. Once the trend have determined they have similar clusters of orders at similar price or technical levels, which then reinforce those levels as points of support or resistance. The frequently tactic employed is to stagger orders to take advantage of any short-term reversals in the direction of the trend. For example if EUR/JPY is at 118.60 and trending higher EUR/JPY buying orders would be placed at arbitrary price points, such as 118.50, 118.25, 118.00, to take advantage of any pullback in the broader trend. Same for the 119.20 level, buying orders would be placed at 119.00, 18.75, 118.50. This also explains why EUR/JPY frequently encounters support or resistance at numerically round levels, even though there may be no other corresponding technical significance. Look for the simetry at A,B,C points as well as a,b,c reversal points.
Try it on a demo first, I know it works for me.
Hope it helps,
mikecanad
Try it on a demo first, I know it works for me.
Hope it helps,
mikecanad
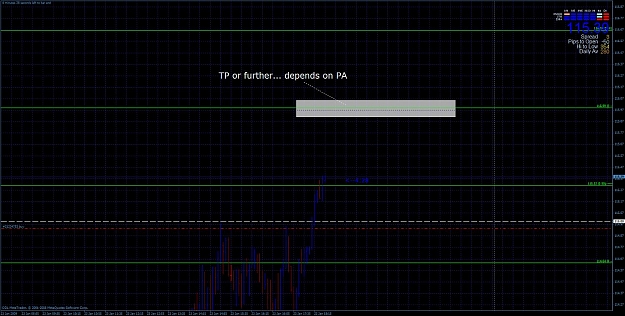
Attached Image (click to enlarge)