|
Joined Nov 2008
|
Status: Building Empire
|378 Posts
Hi guys...and thanks tkpower for that great thread and system...I'm just learning it still. So please comment my two signals if I get this system correctly.
Not exactly text book, but price action based none the less...
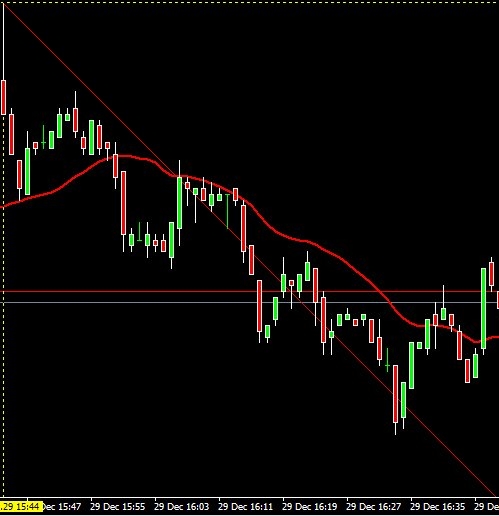
Trade one was not a bear eats bull exactly but the downturn happened quickly so I took it, and my perception was that the bears were taking over. I took the exit because of lost momentum at the R3 pivot line.
Trade two was a bear eats bull. This one was risky because of the pivot as well as the 200sma being right below and the possibility it could become strong support. My reason for taking it was because the overall trend was down and there was momentum in the move. The bull candle prior to the entry bear candle had given up half of its' gains, followed by the bear eats bull.I exited once again after price broke below the 200 and lost momentum.
Ignore the cci34, I just threw it up playing with this new platform...
Joined Oct 2007
|
Status: Summer is the best time of year!
|1,284 Posts
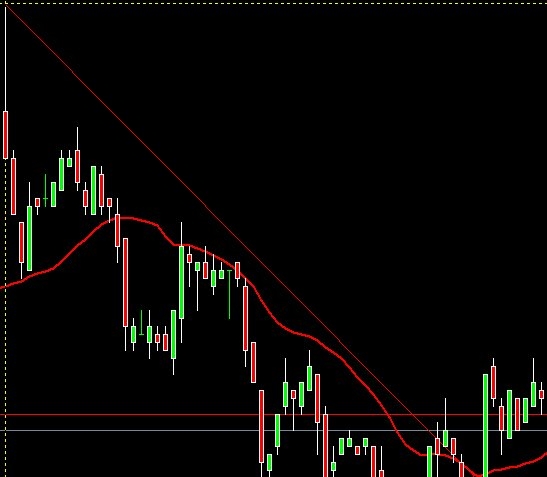
3 trades today. One EJ for BE, one GU for BE and one GU for +20.
the two GU trades are marked. First one was pretty much text book TK method but on M3 and not M2. I moved stop to BE at +10 and got stopped out. The second closed for +20. Not exactly TK method but price action based.
Thanks to Steve who has added to Mike's great work and made this new and improved ED2 indicator. The new indicator also will detect if you are using a 4 or 5 decimal broker without you changing anything.
Ignored
TK & Mikep (Steve)
Thanks for the new indicator. It's very flexible and it looks extremely useful.
Would appreciate a brief User Guide please?
Just wondered how "degrees of angle" is calculated?
On the chart the SLOPE of the price line or an MA is basically in pips per candle (or minute etc)
eg If you draw a trendline it reads "5/10... " etc which is the reciprocal ie candle/pip.
Anyway a 'degree' has no meaning on a price chart where the x(time) & y (pips) scales are zoomed arbitrarily.
So how does your 'degree' relate to the price (MA) slope in terms of pips and time?
I'm asking as I am a long time user of price and MA slope methods.
Joined Oct 2007
|
Status: Summer is the best time of year!
|1,284 Posts
I'm not taking any particular timeframe...I'm looking a price and what it is doing. This trade looked like a sell on three timeframes...I figure that's a good setup. For me, it's not so much as waiting for the exact setup per TK's rules....but a judgement of whether I like the target and where the stop will be. Here, price had clearly broke below R3....for me that was key. I was thinking sell down to R2 and was looking for an entry.
I also was looking at M1 but that's not part of TK's setup, so I'll not include that here.
This trade could have been played a number of ways...a 1-2-3 trade, a break of most recent support. The sell of the pullback. Regardless of how you describe it, the price action was good.
I posted because I think it's a great example of how TK intends this to be traded when viewing M2, M3 and M8.
Thanks for the new indicator. It's very flexible and it looks extremely useful.
Would appreciate a brief User Guide please?
Just wondered how "degrees of angle" is calculated?
On the chart the SLOPE of the price line or an MA is basically in pips per candle (or minute etc)
eg If you draw a trendline it reads "5/10... " etc which is the reciprocal ie candle/pip.
Anyway a 'degree' has no meaning on a price chart where the x(time) & y (pips) scales are zoomed arbitrarily.
So how does your 'degree' relate...
Ignored
Simply because a chart is displayed in a log format does not change the Cartesian plane on which it is built.
You are correct that degree has little meaning in regards to the zoom of a logarithmic display, however, the underlying (xn+yn) = a 1 rise for a 1 run retaionship or 45 degrees of angle still applies to the movement of price and time relation of one to one.
If you look at the last part of this indicator program you will see it is based on that design of 1 to 1.
Of course the exact degree number and it's accuracy is really not important in relation to this indicator, because it is only related to itself.
It would appear that through trial and error, these degree numbers were found to be best.
To be absolutely correct, a ratio would be more accurate, but Most people would find that cumbersome, myself included.
Or you could take the rise (sine) divided by the run (cosine) for the tangent. But then that would be even more awkward.
Degrees is probably a good compromise, but you are correct in saying the MA line would not necessarily view the same as the degree for which it is on a fixed x,y plane. But the purpose is to establish a minimum rise over a fixed run to determine if the arrow criteria has been satisfied.
No offense, but this post was in a different language. (Cartesian plane, zoom of a logarithmic display. x+n,y+n, sine divided by cosine). Man O man. I thought this was supposed to be an EASY system!!?? .
Simply because a chart is displayed in a log format does not change the Cartesian plane on which it is built.
You are correct that degree has little meaning in regards to the zoom of a logarithmic display, however, the underlying (x+n,y+n) = 45 degrees still applies to the movement of price and time relation of one to one.
If you look at the last part of this indicator program you will see it is based on that design of 1 to 1.
Of course the exact degree number and it's accuracy is really not important in relation to this indicator, because...
No offense, but this post was in a different language. (Cartesian plane, zoom of a logarithmic display. x+n,y+n, sine divided by cosine). Man O man. I thought this was supposed to be an EASY system!!?? .
Ignored
Sorry, I was trying to answer his question fully.
LOL
It means that the degree inputs are the easiest to use and find meaning in.
that's all.
(Cartesian plane, zoom of a logarithmic display. x+n,y+n, sine divided by cosine). Man O man. I thought this was supposed to be an EASY system!!?? .
Ignored
Yeah, it seems thatwasme is a mathematically educated guy. He was answering a 'degree of slope' question. Don't get confused, I don't think you need to know any of that to trade this system.
I've been watching closely and I'm trading this thing next week. It's Holiday time here now.
'Til then !!
Simply because a chart is displayed in a log format does not change the Cartesian plane on which it is built. Eh?
You are correct that degree has little meaning in regards to the zoom of a logarithmic display, however, the underlying (xn+yn) = a 1 rise for a 1 run retaionship or 45 degrees of angle still applies to the movement of price and time relation of one to one. y/x pips per minute
If you look at the last part of this indicator program you will see it is based on that design of 1 to 1.
Of course the exact degree number and its accuracy is really not important in relation to this indicator, because it is only related to itself. Just a number
It would appear that through trial and error, these degree numbers were found to be best. OK
To be absolutely correct, a ratio would be more accurate, but Most people would find that cumbersome, myself included. same as a drawn trendline!
Or you could take the rise (sine) divided by the run (cosine) for the tangent. But then that would be even more awkward. Put like that, yes!
Degrees is probably a good compromise, but you are correct in saying the MA line would not necessarily view the same as the degree for which it is on a fixed x,y plane. But the purpose is to establish a minimum rise over a fixed run to determine if the arrow criteria has been satisfied. Agreed ...
Ignored
Thanks for the quick reply - I think!
Sorry if I've offended - just curious - no wind up intended.
BTW the first revision referred to "PipDelta" only, which made sense but I'll just use the 'degrees' as slope numbers. (is PipDelta the change over one candle?)
Anyway thanks for the indicator I am finding it very useful.
I'd still appreciate a quick User Guide for the various available inputs please.
Sorry if I've offended - just curious - no wind up intended.
BTW the first revision referred to "PipDelta" only, which made sense but I'll just use the 'degrees' as slope numbers. (is PipDelta the change over one candle?)
Anyway thanks for the indicator I am finding it very useful.
[color=#0000ff]I'd still...
Ignored
Please, no offense here at all I just was hoping to answer your question fully. I have no emotion in this at all. the thanks goes to TK. LOL
PS, I am very sorry if I sounded at all offended, I thought your question was a good one and deserved an in depth answer.
ThatWasMe, I was just trying to lighten things up. Wish I had the math knowledge you have. Don't let me or anyone else stop you from giving detailed explanations that contain math solutions.
TK, two questions. Did you add a "Volumes" indicator to the revised template? If so, how is it used? Also, did you change the breakout time for trading from white to gray? On the former template, it was white after 1400 hours GMT. Now, it's gray.
Thanks.
I can't use the two screens only method as I only have one laptap at the moment and I don't believe in flipping through screens either. I have therefore been testing this ED2 on EUR/USD only today (purely for the 33% less costs) and I have been using the M8 as another trade timeframe opportunity.
Today it has worked beautifully (especially this afternoon). Tomorrow who knows?
All other rules remain the same, I just use all 3 timeframes for trading opportunities. Any comments/criticisms of this idea are of course very much appreciated.
|
Joined Aug 2008
|
Status: too stubborn to quit
|280 Posts
OK, after trying many systems posted here at FF I'm convinced this is the one for me. Today was my best day in Forex ever. I use this system but also an EA designed for another system. The EA is called feb helper and its on the "system II (with irony)" thread. It allows you to trail stops from your entry, not just when your +15 pips like the platform. So I set the parameters to SL 10 TSL 5 and TP 20 then I enter a pending order that's two pips from the high/low of the candle I'm stalking. If the next candle triggers, I'm in. If it wiggles a little and then back tracks, I get stopped out for a few pips. If it takes off, its like 20 pips in one or two candles usually. Truly an ATM for me anyway. Thanks for putting this system up, the PDF's the templates etc. You've made a lot of people really, really happy I'm sure.