That long legged Doji isn't inspiring for either direction!!!!!
Ignored
there are more or less 5 bars almopst all dojies, with arange of 50 pips..
BS PA
Dow made a breakout and retracing now.. we are going to see UP and DOWN movements...
Unless you are trading on a High TF with a clear directions, all this movements are the same as before the major NEWS..
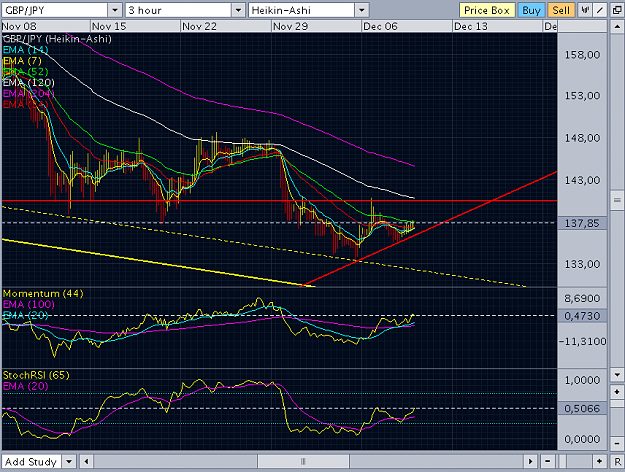
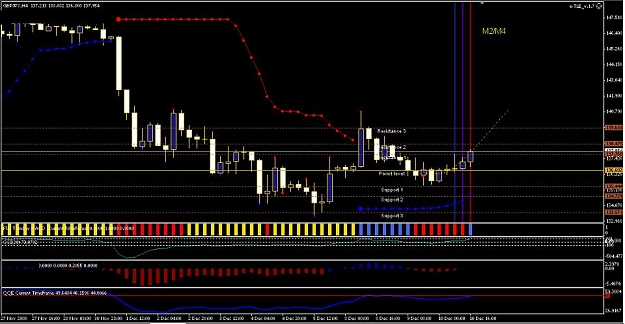
H1 also above HILO..Is there any possibilities going to TL 138.03 then test to 138.59 before R3 at 139.75 ....
I have -2++ pips short since 135.XX..Pls share any finding
Ignored
Here is what I am looking at and PLEASE remember I am very new so I can be wrong.
The best option I will take is Piters. "have a look your last 4 bars on GY.. 15 min. This PA is very dangerous.. have a break, come back later..
you DONT HAVE TO TRADE"
Price will have to break out of the daily trend to see higher price which is ar'd 138.56/139 area like someone has already stated.
If price gets a daily close above 138.50 then the next target will be 141.50 which is daily gann, above there will see 148 congestion zone where it has been rejected before.
If price fails up here I see 132 1st stop then 120 area. . . Right now it looks like price is having a difficult time getting above the descending trendline since Sept but the day isn't over yet.
My gut tells me we will see a spike up to touch the top of the channel this afternoon then price will be sold off from there. . .
Today is triple interest Wed not that it means alot these days. . .
This market PA can do anything to shakeout the shorts...
The daily TL is still holding...There is still room on the upside until 141 range w/o breaking the Daily TL.
I am still overall bearish...The bailout plan is not giving the Little 3 the full amount...That means the company will have to merge and layoff massive amount of workers...
Price will have to break out of the daily trend to see higher price which is ar'd 138.56/139 area like someone has already stated.
If price gets a daily close above 138.50 then the next target will be 141.50 which is daily gann, above there will see 148 congestion zone where is has been rejected before.
If price fails up here I see 132 1st stop then 120 area. . . Right now it looks like price is having a difficult time getting above the descending trendline since Sept but the day isn't over yet.
setup is very simple hold longs until double top (horizontal line)
if u will see bearish div on m5 nearby then TP and reverse if wont then keep longs open
or
short hard when LTL will be broken