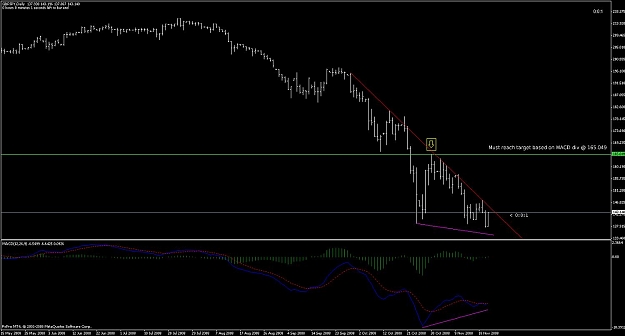
Im observing a similar scenario as well. I say if the divergence will be confirmed she might go to a possible target 165.049 - the last months high i have drawn in light green coloured horizontal line. Heres simple chart thats on my screen right now. Lets see where the price wants to go.
Dislikedbefore i dive into the weekend, i thought about posting these charts here along with some quick notes. i'm sure something similar has been mentioned before (if so, i apologize as i don't have time to read all the posts) but i think it is very important.
daily shows a bullish regular divergence on RSI and CCI; qqe has crossed up. if that green trend line is broken (that is, 148 is taken), i think we can say hello and shake hands with 160 because this beast will fart a nice rally.
h4 is going up. we can see the bullish regular divergence on RSI, CCI...Ignored
Attached Image (click to enlarge)