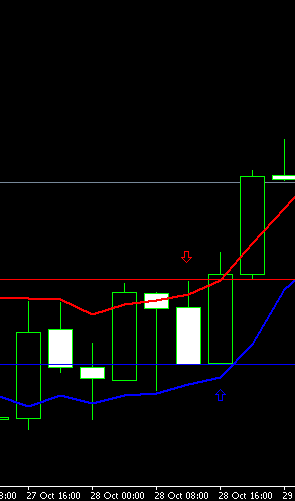
the red arrow on the chart is the set up bar, and the blue arrow is the reversal bar.
the red horizontal line is the SL for the sell stop and
the blue horizontaal line is the entry point for the sell stop
price went up and stop me out at the red line
the question now sir is that, should I just make the red line point which is the SL my new buy stop entry point for the reversal trade and the blue line now my new SL
ps the chart may not be an ideal one is just to convey my question
thanks sterling for the pains
Attached Image
John 3:16 - From THIS love no power on earth can me sever.