Joined Nov 2005
|
Status: Trading, writing, conquering.
|721 Posts
A good one on chart patterns, but not specific to the FX market is Getting Started in Chart Patterns by Thomas N Bulkowski. Chart patterns and price action doesn't differ really between markets, so a book on Stocks price action (as that one is) has just as much relavence to the fx markets. You will just have to ignore the volume related stuff.
You can quit and they won't care, but you will always know.
this is about Trading Double Tops and Double Bottoms...
"No chart pattern is more common in trading than the double bottom or double top. In fact this pattern appears so often that it alone may serve as proof positive that price action is not as wildly random as many academics claim."
I never criticize colleagues. At least not for their market opinions. Everyone is allowed to have one and by backing it up with an actual position a trader should always get a full pardon for possible mistake that he might have committed by taking this trade. However, this investopedia theoretical article about double tops and bottoms seems like a pure nonsense to me. Such vigil approach to classic technical analysis is a direct way straight to disaster. Here are a couple of points I would like to make in support of my opinion:
1. In accordance with classic TA a double top/bottom formation is a reversal pattern. It can only be formed on the very top/bottom of a trend. Therefore the picture#2 in the article illustrating double bottom could be anything but what it is actually supposed to illustrate.
2. In accordance with classic TA such formation cannot be anticipated. It can only be seen after it is fully formed and the neckline is broken. Anticipating a double top formation is almost the same thing as anticipating a rain in Sahara desert. It happens sometimes, but happens so rarely that almost any sequence of preemptive trades is likely to lead to a total account loss even before a single positive strike will take place.
3. Double top/bottom formations in fact are extremely rare in Forex. Being myself a technical trader I took perhaps not more than a dozen of trades based on this formation over 14 years of my trading career and lost on more than a half of them because of false neckline breaks. I cannot see them forming neither every day (like the author states) nor even once a year. But even when actually seen, they should only be traded if supported by other thoughts and reasons. If someone wants to learn TA the right way I would strongly recommend reading classics such as Murphy’s “Technical analysis of the financial markets”.
Ignored
there you go, 3 double bottoms on cable in the last 6 months. all giving sizable moves.
Attached Image
With a break always expect a pullback, otherwise, you're dead meat/
Is there a good book on price action in FX Market?
Ignored
akuma gave you an excellent source.
look at pinbars, learn the context. the james16 thread has a lot about it. learn to blend bars to get intent.
learn to read price (say, see how 15 minute hammers form by seeing 5 minute bars). honest. best thing you can do.
With a break always expect a pullback, otherwise, you're dead meat/
2 double bottoms with 4 days difference. first one signals the move, second triggers. lol.
Ignored
This is exactly what I was talking about. Everyone sees in the charts what he wants to see by disregarding the basic rules. Then some complain that TA doesn't work. In fact, those patterns are not double bottoms in a classic TA sense. Neighboring extremes formed at the same levels alone don't make the whole set to become such a formation. I'm not even talking about the fact that just two consecutive bars cannot represent such formation at all because no neckline is visible.
|
Membership Revoked
|
Joined Dec 2006
|2,771 Posts
The point that I’m trying to make here is very simple. If TA is a science, then there shouldn’t be any discretion in pattern recognition. In other words, any number of traders with similar level of knowledge and qualifications must have the same views on each certain technical pattern formed on the charts. However, if the pattern recognition depends on a personal view of each trader, then any set of bars becomes an issue of personal imagination and TA just loses its practical value completely. Therefore there are some certain rules exist in order for TA to stay scientific. Not following those rules makes the whole thing useless.
i just brought up this, cause my trading is centered around double tops/bottoms for quite some time now...that was before i even noticed this article...but i have to say, that i also take the "2 B test of top/bottom" labeled by trader vic and the 123 high low labeled by joe ross into what i call double top/bottom pattern..so, for me this is a pattern with different variations and my core approach is to exploit this single pattern
but, i would say, the trick on this pattern is the right "context" of course...
example...lets take a look at euryen on the daily chart... since january, there where three 2b test of top pattern, incl the last one...i bought yen above 15900 acc to my method and was quite lucky..anyway, day in day out, there are numberless DT or DB occuring on any timeframe
anyway, i think that for some newcomer, who is interessted in trading on price pattern, the double top/bottom is worth a close look
of course there are other pattern worth taking a look at
Ignored
Hi, from your opinion,
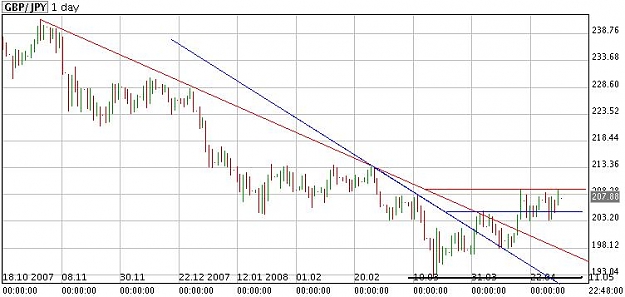
which one would be a trader vic trendline? I have attached a pictur below. Why do i question this? Basically i can't fathom how to intepret his explanation, just by looking at the chart below, but he said,
For a downtrend, within the period of consideration, draw a line from the highest high point to the lowest minor high point preceeding the lowest low so that th eline does not pass through prices in between the two high points. Extend the line past the lowest high point downwards.
So the red trend line completes the first rule; "draw a line from the highest high point", but it only gets broken when the price action makes a higher low and it does not connect to the "lowest minor high preceeding the lowest low". So can we conclude that the red TL is invalid. It does seem to me that the blue TL seems to be a more valid trendline BUT it does not meet trader vic's first rule which is to draw the line from the Highest high, or does it?
from what i can gather is the best trendlines to do the 1-2-3 setup for fx, scrap the first rule of highest high or lowest low and just use his second rule, i.e. just eyeball the lowest low and the swing created before it, exampled in the blue trendline below. What do you think?
from what i can gather is the best trendlines to do the 1-2-3 setup for fx, scrap the first rule of highest high or lowest low and just use his second rule, i.e. just eyeball the lowest low and the swing created before it, exampled in the blue trendline below. What do you think?
Ignored
Hello jest1081,
Long time no talk. I've had this sort of puzzle for a while. Now it looks to me both red and blue lines are valid, in that the red line is actually a trendline longer than a day, say making it as a weekly trendline. If you read it as a daily line, it already had HHs HLs in between. So the blue is a daily trend, and red a weekly/monthly trend.
Yes. Now I just eyeball the HI LO before and after the breaks of the breaklines. It seems to me a consolidation level (resting / undecided area) that a break is awaited.
Joined Sep 2006
|
Status: Chasing Trends
|2,339 Posts
hey pipal, long time indeed.
hehe.
well multitimeframe trading is head wrenching, you know, weekly, monthly etc etc, lol, i believe price moves simpler than that and price action is not preceeded by time like most people suggested...
from my exploits i have noticed that ticks has been the best indicator for trading price...