If I look at last two bars on all 6 pairs' charts in FXDD, the time would be 2008.09.22 18:30 bar and 19:00 bar I'm looking at on all 6 pairs:
EURUSD 18:30 close = 1.4695, 19:00 close = 1.4688, so gain of 7 pips if selling.
GBPUSD 18:30 close = 1.8482, 19:00 close = 1.8462, so gain of 20 pips if selling.
AUDUSD 18:30 close = 0.8439, 19:00 close = 0.8424, so gain of 15 pips if selling.
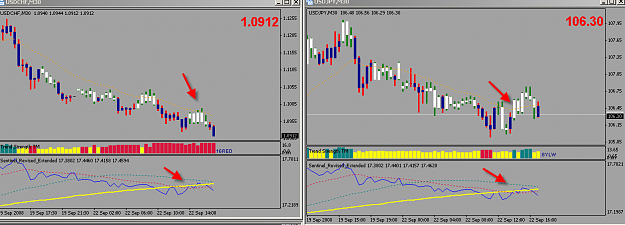
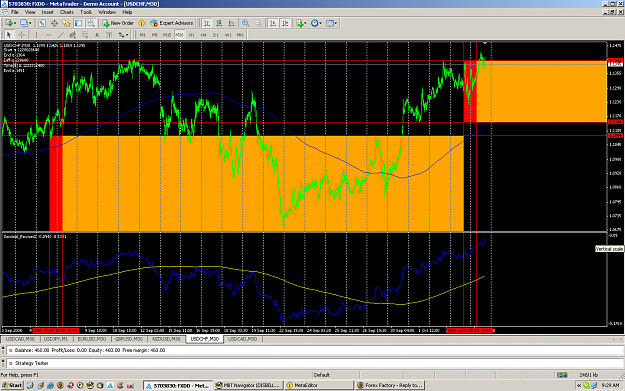
USDCHF 18:30 close = 1.0834, 19:00 close = 1.0827, so loss of 7 pips if buying.
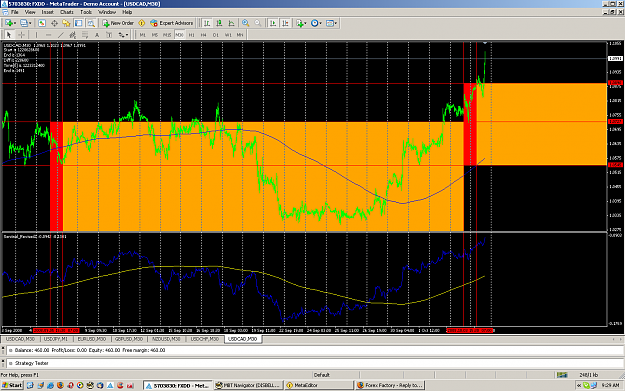
USDCAD 18:30 close = 1.0381, 19:00 close = 1.0376, so loss of 5 pips if buying.
USDJPY 18:30 close = 106.35, 19:00 close = 106.40, so gain of 5 pips if buying.
So add these gains/losses together, and you get:
7+20+15+(-7)+(-5)+5 = 35
But if I look at:
original Sentinal Index (set to MODE 1 for pips), at 18:30 close is 701.2857, 19:00 close is 701.4286, for gain of 0.1429.
Sentinal Revised, at 18:30 close is 17.3850, 19:00 close is 17.3938, for gain of 0.0088.
Sentinal Revised Extended 2 (attached), at 18:30 close is -52196, 19:00 close is -52137, for gain of 59.
So we gained 35 pips during that half hour if we would have been "buying USD", but none of the indicators are showing this correctly. Even if I take averaging of original Sentinal into account, and instead don't average, that would be .1429 * 6 pairs, to equal .8574 gain.
Well, I would think it would be simple to fix this, but like most things, it does not appear to be so simple. If I look on the chart, Sentinal Revised Extended 2 looks more like original Sentinal Index indicator's lines, where Sentinal Revised doesn't look like either of the other two. This leads me to believe that the decimal is making a problem in Sentinal Revised indicator, which I've (hopefully) fixed in Sentinal Revised Extended 2 by separating USDJPY from the others and making PipsAsWholeNumber set to True.
When Sentinal Revised Extended 2 has PipsAsWholeNumbers set to False, it looks like Sentinal Revised when on chart. When Sentinal Revised Extended 2 has PipsAsWholeNumbers set to True, it looks like original Sentinal Index (MODE 1) when on chart. I'm thinking Sentinal Revised hasn't taken the decimal problem into account, where the other two are.
Don
EURUSD 18:30 close = 1.4695, 19:00 close = 1.4688, so gain of 7 pips if selling.
GBPUSD 18:30 close = 1.8482, 19:00 close = 1.8462, so gain of 20 pips if selling.
AUDUSD 18:30 close = 0.8439, 19:00 close = 0.8424, so gain of 15 pips if selling.
USDCHF 18:30 close = 1.0834, 19:00 close = 1.0827, so loss of 7 pips if buying.
USDCAD 18:30 close = 1.0381, 19:00 close = 1.0376, so loss of 5 pips if buying.
USDJPY 18:30 close = 106.35, 19:00 close = 106.40, so gain of 5 pips if buying.
So add these gains/losses together, and you get:
7+20+15+(-7)+(-5)+5 = 35
But if I look at:
original Sentinal Index (set to MODE 1 for pips), at 18:30 close is 701.2857, 19:00 close is 701.4286, for gain of 0.1429.
Sentinal Revised, at 18:30 close is 17.3850, 19:00 close is 17.3938, for gain of 0.0088.
Sentinal Revised Extended 2 (attached), at 18:30 close is -52196, 19:00 close is -52137, for gain of 59.
So we gained 35 pips during that half hour if we would have been "buying USD", but none of the indicators are showing this correctly. Even if I take averaging of original Sentinal into account, and instead don't average, that would be .1429 * 6 pairs, to equal .8574 gain.
Well, I would think it would be simple to fix this, but like most things, it does not appear to be so simple. If I look on the chart, Sentinal Revised Extended 2 looks more like original Sentinal Index indicator's lines, where Sentinal Revised doesn't look like either of the other two. This leads me to believe that the decimal is making a problem in Sentinal Revised indicator, which I've (hopefully) fixed in Sentinal Revised Extended 2 by separating USDJPY from the others and making PipsAsWholeNumber set to True.
When Sentinal Revised Extended 2 has PipsAsWholeNumbers set to False, it looks like Sentinal Revised when on chart. When Sentinal Revised Extended 2 has PipsAsWholeNumbers set to True, it looks like original Sentinal Index (MODE 1) when on chart. I'm thinking Sentinal Revised hasn't taken the decimal problem into account, where the other two are.
Don
Attached File(s)