I'll tell you one thing, if I would happen to see a bullish weekly bar at this low, I'd ride it to heaven and just collect the whole way up. Well, at least until a bearish weekly comes into play.
Ignored
Check back a few posts ive made. GBP/JPY dayly chart shows a possible bottom and it has hit the ltl of the descending broadening formation and bounced hard. Also on USD/JPY we have the same pattern. Anyway lets see how that dayly pinbar plays out
Joined Aug 2007
|
Status: The Weather Man
|8,859 Posts
when i said that we have reached the bottom, some didn't even take that into consideration. but oh well, allow me to elaborate myself a bit. everyone back at 215 agreed that we were at wave 4 in a downtrend. we were just arguing back then when wave 4 will end. and i'm sure now that everyone agrees we are at wave 5. if we draw a FE setup from wave 2-3-4, we get a FE setup that i posted last week claiming that 166-167 (FE 100) should be AT LEAST a temporary bottom, if not the ultimate bottom of this 5 wave move (weekly chart.
some also agree that wave 5 consists of 5 consecutive waves.
i'm not sure if we're at wave 5 of 5, but, this might be it if this count is correct (daily chart). if this is not wave 5 of 5 then we might expect another leg down (which i highly doubt) AFTER a WAVE 4 of 5. so this puts us at 2 possibilities
1) we are currently at the bottom of wave 3 of 5 of wave 5, and about to start wave 4 of 5.
2) we are currently at the bottom of wave 5 of 5, and about to enter a ABC correctional fase.
there's also one more thing i would like to mention. belekas has posted a trendline on the weekly/daily charts that i really like, not only is it showing normal TL being hit, the formation itself (broadining falling wedge) suggests a massive reversal going for the upper TL. that might also happen after the corrective ABC waves. not to forget that a lower TF (daily) is showing a good bullish divergence on CCI30.
Fibonacci series works as follows
0 0 1 2 3 5 8 13 21 34 55 89 144 233 377 610 987 1597 2584 4181
...
following this we have already come down below the 2584 level and are headed towards the 4181 level at 155.60
this will be negated only and only if we see a trend reversal on daily.
Ignored
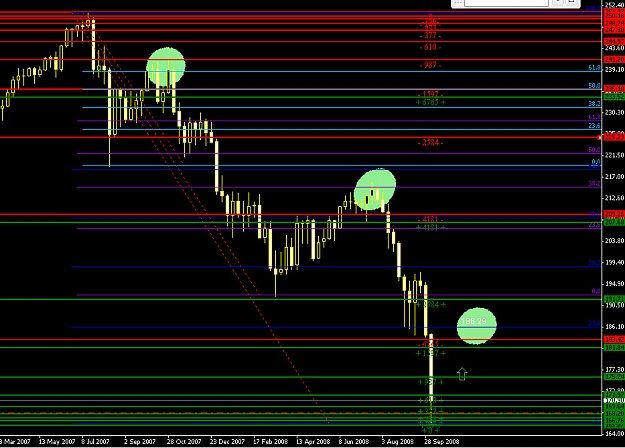
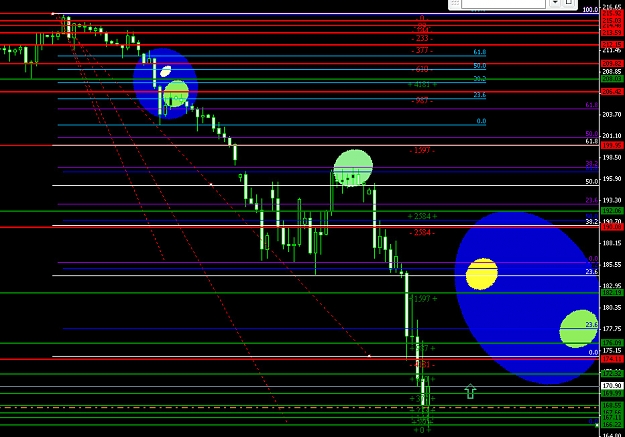
those are called fib zones, if you plot them directly on charts as lines;
here's two charts, one is a weekly from 251 (highest high in recent past) and the second is a daily, from the most recent high (215) down;
now if you notice, every fib zone line once crossed down is due a retrace, up to the first normal fib retrace level of that move down; if that fib breaks we going up to the next fib level, if it holds the thing is going down for another tumble..;
and thus we are now below the -6765 FZL from 251, which is ...outrageous
not only that, but also the previous fib zone line crossing (-2584 on daily from 215) didn't get its normal retrace (yellow circle), so that makes now two fib zone lines that are crying for retrace - see analogy higher up (-610);
23.6 or 177.75 is the first fib line that needs to be touched on the way up, if we follow the daily chart from 215;
if everything goes fine with that, we go up further to the next significant level, the 185-186, which should correspond to both the 38.2 FR from 215 (blue), and the 23.6 FR (white) overdue to -4181 fib zone line crossing, and the 23.6FR from 251; From there, we'll see.
At this point, I don't see potential for a lower move, considering that two fib zone lines are overdue retrace, and everybody is sick and tired of current fundamentals; On the other hand, I see 186 as the test for a definitive trend change in the coming weeks; and of course no need to mention, these are daily and weekly bars, expect high volatility and noise around.
Attached Image(s) (click to enlarge)
"Everybody needs money. That's why they call it money" - Danny De Vito
those are called fib zones, if you plot them directly on charts as lines;
here's two charts, one is a weekly from 251 (highest high in recent past) and the second is a daily, from the most recent high (215) down;
now if you notice, every fib zone line once crossed down is due a retrace, up to the first normal fib retrace level of that move down; if that fib breaks we going up to the next fib level, if it holds the thing is going down for another tumble..;
and thus we are now below the -6765 FZL from 251, which is ...outrageous
not only that, but also the previous fib zone line crossing (-2584 on daily from 215) didn't get its normal retrace (yellow circle), so that makes now two fib zone lines that are crying for retrace - see analogy higher up (-610);
23.6 or 177.75 is the first fib line that needs to be touched on the way up, if we follow the daily chart from 215;
if everything goes fine with that, we go up further to the next significant level, the 185-186, which should correspond to both the 38.2 FR from 215 (blue), and the 23.6 FR (white) overdue to -4181 fib zone line crossing, and the 23.6FR from 251; From there, we'll see.
At this point, I don't see potential for a lower move, considering that two fib zone lines are overdue retrace, and everybody is sick and tired of current fundamentals; On the other hand, I see 186 as the test for a definitive trend change in the coming weeks; and of course no need to mention, these are daily and weekly bars, expect high volatility and noise around.
Ignored
the fib series are always drawn from reversal points and never from tops or highs.
the recent reversal on monthly, weekly and daily are given in the charts below.
Joined May 2007
|
Status: I Love EMAS!
|1,968 Posts
The market is being controlled by panic and fear. Markets are spooky. Things are so scary, that the world's government leaders are meeting to solve this crisis, if possible.
Smart money has a Risk Aversion Sentiment strategy.
We need to see this sentiment subside before any meaningful trend changes are to occur.
Stand aside with cash ready to exploit some no-brainer trade opportunities this week.
the fib series are always drawn from reversal points and never from tops or highs.
Ignored
That is the reversal point (on top), you are looking to the direction you follow, not for the direction you anticipate; and it's the same picture, even if if you do it other way around;
On the other hand, when it comes to trend reversal, all indicators are lagging, no matter what;
"Everybody needs money. That's why they call it money" - Danny De Vito
That is the reversal point (on top), you are looking to the direction you follow, not for the direction you anticipate; and it's the same picture, even if if you do it other way around;
On the other hand, when it comes to trend reversal, all indicators are lagging, no matter what;