A Nice Leading Indicator
Have you ever said, “Wouldn't it be nice if someone (or something) would give me a warning before an event occurred rather than after that event happened.”
Having a “head's up” before prices change direction would be mighty nice, would it not? Well, there is such a tool as a “Leading Indicator” which if used properly will give you fair warning that changes are coming.
Some Examples
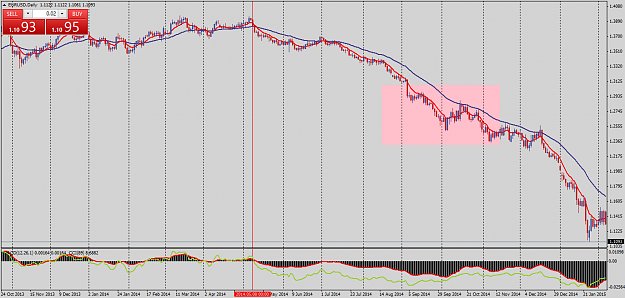
Take a look at this one minute chart on the EUR/USD pair.
http://tinkerpaw-software.com/images/fig_1.gif
Figure 1.1
Notice that most of the time the BLUE line crosses the RED line before the price changes direction. Sometime the cross happens at the same moment price changes direction, but that is still a good indicator.
The first two yellow circles show crosses that happen 5 minutes before the price changes. The rightmost yellow circle shows a cross that happens just as the price turned.
Look at the following AUD/USD 15 minute chart:
http://tinkerpaw-software.com/images/aud-15.gif
Figure 2-2
Here you see 4 yellow circles highlighting 4 different changes of direction, each one giving at least 15 minutes of advanced warning that a price change was in the works.
Setting up the Indicators
First, place a MACD indicator on the chart of your choosing. Next open the “Navigator” by typing a CTRL+N, or selecting Navigator from the “View” menu. Next expand the “Indicators” tree list. Now, put the cursor on the Commodity Channel Index indicator and drag it on top of the MACD window in the chart. If you do this correctly you will get a window where the CCI indicator is superimposed on top of the MACD indicator.
Next, set the MACD values as follows:
Fast EMA = 12
Slow EMA= 26
MACD SMA = 1
and set the colors to something bright and easy to see. Red over silver seems nice.
Now set the CCI period to 26 and apply to Meddian Price (HL/2). Again, set the color to something bright, such as light blue.
Summary
There you have it. The CCI over the MACD will give you a decent leading indicator that you can rely on to warn you of impending changes in price direction.
NOTICE: You should not use this indicator for buy or sell signals since its purpose is to warn you of price changes, not pin point the moment changes occur. Indeed, these warnings most always come several minutes (or longer) in advance. A use of other reliable indicators will help generate buy and sell signals.
Actually, after the warning cross, I then watch for the MACD to turn direction for an entry or exit point.
Good luck to all you PIP happy traders,
Tom Trader
Have you ever said, “Wouldn't it be nice if someone (or something) would give me a warning before an event occurred rather than after that event happened.”
Having a “head's up” before prices change direction would be mighty nice, would it not? Well, there is such a tool as a “Leading Indicator” which if used properly will give you fair warning that changes are coming.
Some Examples
Take a look at this one minute chart on the EUR/USD pair.
http://tinkerpaw-software.com/images/fig_1.gif
Figure 1.1
Notice that most of the time the BLUE line crosses the RED line before the price changes direction. Sometime the cross happens at the same moment price changes direction, but that is still a good indicator.
The first two yellow circles show crosses that happen 5 minutes before the price changes. The rightmost yellow circle shows a cross that happens just as the price turned.
Look at the following AUD/USD 15 minute chart:
http://tinkerpaw-software.com/images/aud-15.gif
Figure 2-2
Here you see 4 yellow circles highlighting 4 different changes of direction, each one giving at least 15 minutes of advanced warning that a price change was in the works.
Setting up the Indicators
First, place a MACD indicator on the chart of your choosing. Next open the “Navigator” by typing a CTRL+N, or selecting Navigator from the “View” menu. Next expand the “Indicators” tree list. Now, put the cursor on the Commodity Channel Index indicator and drag it on top of the MACD window in the chart. If you do this correctly you will get a window where the CCI indicator is superimposed on top of the MACD indicator.
Next, set the MACD values as follows:
Fast EMA = 12
Slow EMA= 26
MACD SMA = 1
and set the colors to something bright and easy to see. Red over silver seems nice.
Now set the CCI period to 26 and apply to Meddian Price (HL/2). Again, set the color to something bright, such as light blue.
Summary
There you have it. The CCI over the MACD will give you a decent leading indicator that you can rely on to warn you of impending changes in price direction.
NOTICE: You should not use this indicator for buy or sell signals since its purpose is to warn you of price changes, not pin point the moment changes occur. Indeed, these warnings most always come several minutes (or longer) in advance. A use of other reliable indicators will help generate buy and sell signals.
Actually, after the warning cross, I then watch for the MACD to turn direction for an entry or exit point.
Good luck to all you PIP happy traders,
Tom Trader