• Home
  • Forums
  • Trades
  • News
  • Calendar
  • Market
  • Brokers
  • Login
  • Join
  • User/Email: Password:
  • 7:26pm
Menu
  • Forums
  • Trades
  • News
  • Calendar
  • Market
  • Brokers
  • Login
  • Join
  • 7:26pm
Sister Sites
  • Metals Mine
  • Energy EXCH
  • Crypto Craft

Options

Bookmark Thread

First Page First Unread Last Page Last Post

Print Thread

Similar Threads

How to Correctly BackTest, Collect Data, and Analyze A System 13 replies

How much historical data needed to backtest day trading system 0 replies

Visual backtest result different from non-visual backtest 0 replies

data needed to backtest system 1 reply

How to backtest system with past data? 8 replies

  • Trading Systems
  • /
  • Reply to Thread
  • Subscribe
  • 41
Attachments: NFP System - Backtest data provided
Exit Attachments

NFP System - Backtest data provided

  • Last Post
  •  
  • 1 1314Page 151617 20
  • 1 14Page 1516 20
  •  
  • Post #281
  • Quote
  • Aug 28, 2008 6:34pm Aug 28, 2008 6:34pm
  •  deanz
  • Joined Nov 2005 | Status: Member | 113 Posts
I have been hacking around this indicator for a while, over here is the latest version that should fix the updating problem, at the cost of more CPU usage.

http://www.forexfactory.com/showthread.php?t=99145

You could also use a broker that has USDX.

http://www.forexfactory.com/showthread.php?t=39722

oh and that server file the guy uploaded in not a zip but a "rar" file so change the extension name or else you will not be able to open it.

Dean.
perception is reality
 
 
  • Post #282
  • Quote
  • Aug 29, 2008 10:42am Aug 29, 2008 10:42am
  •  disbellj
  • Joined Aug 2008 | Status: Member | 772 Posts
Dean,

Thank you for posting your reply.

I downloaded the indicator from the other thread you mentioned, and see it does calculate a different way. Will check out the USD indicator from that thread and compare to Sentinal Index and also my indicator I made.

I will also check out the USD Index. Do you know what currency pairs are used to calculate the USD Index?

BTW, as all traders learn sooner or later, if you over-leverage or trade with emotions, you'll lose your gains quickly. Happened to me a couple nights ago. I had my money management set for a certain stop loss and risk. It looked good on paper. When I risked more than I have been, played on a lower timeframe, and saw it go against me, I didn't close the trades, but let them go against me until I had lost all my previous gains I had talked about in the previous post. I was like a deer in the headlights. After being in a funk for a day, I wrote down all the rules I had broken, and plan on reading them every time before I trade. Must plan the trade, and trade the plan - without emotion. And go conservative on money management. Better to build small along the way than risk it all on a trade or two. We live and learn (hopefully).

Don
 
 
  • Post #283
  • Quote
  • Aug 29, 2008 5:02pm Aug 29, 2008 5:02pm
  •  Kevin_E
  • | Joined Mar 2007 | Status: Member | 33 Posts
Hello everybody!

It has been a long time, hasn't it? Since I posted this, and the overwhelming responce, I decided to get into programming MQL4 code. I have been a programmer for 5 years, but never actually looked into MQL4 until recently. Fortunately, it's extremely similar to C/C++, so my migration was seemless. Now, I'm a full time programmer for a forex firm out of Dallas, and do contract work for a firm out of Austin (Texas). It's been a wild rollercoaster since the first post =) So, with all this in mind, I really apologise for dissapearing the way I did. I'm going to take the liberty of re-coding the indicator. There are two fundamental problems:

1. The indicator will only update on a per tick basis, and only on the indicator that you have attached to the chart. I can, and will, fix this issue.

2. There is no use of the iBarShift function to determine the time of the current bar versus all the previous bars on the different pairs...IE if there was any sort of price/time gap at all in history on any of the 7 pairs, it will effectively un-sync your comparisons, and you will be getting incorrect values for your line (sometimes extremely incorrect). This problem will be fixed too.

These are both simple problems to fix, so after I finish up something for my employer this weekened, I'll make the changes and upload the indicator. Update me, how has everybody been doing with this system? I myself have not been keeping up with it, becuase of all the other systems I have been coding for people, I haven't had the time =( Thanks for being patient, and not letting this thread die =)

-Kev
Savage Pip Fiend
 
 
  • Post #284
  • Quote
  • Aug 29, 2008 5:17pm Aug 29, 2008 5:17pm
  •  tdion
  • Joined Nov 2005 | Status: EURUSD Quant FREAK | 3,197 Posts
I CAN'T BELIEVE IT!

Kevin, welcome back! This was one of my favorite threads and I hated watching it die. How has your system performed since you originally posted it?

It seemed to make some logical sense, but unfortunately irrational market behavior can screw up most any great system.

Look forward to more great discussion!
 
 
  • Post #285
  • Quote
  • Aug 31, 2008 12:42am Aug 31, 2008 12:42am
  •  disbellj
  • Joined Aug 2008 | Status: Member | 772 Posts
Kevin,

If the problems you said you'd fix, are fixed, then I think this would be the best indicator in the world personally. I'm definitely looking forward to the fixed version. Did you see the results I've already had a few posts back?

SilverB,

I'd be interested in the specifics if you're willing to elaborate, re: 10 x improvment in results

Thank you both.

Don
 
 
  • Post #286
  • Quote
  • Aug 31, 2008 1:41am Aug 31, 2008 1:41am
  •  tdion
  • Joined Nov 2005 | Status: EURUSD Quant FREAK | 3,197 Posts
Cool.....

Quoting disbellj
Disliked
I'd be interested in the specifics if you're willing to elaborate, re: 10 x improvment in results
Ignored
 
 
  • Post #287
  • Quote
  • Aug 31, 2008 2:00am Aug 31, 2008 2:00am
  •  deanz
  • Joined Nov 2005 | Status: Member | 113 Posts
Don you can find out what makes up the USDX at:
http://www.akmos.com/main/forex/usdx.html
you can input all these values into the idicator [except for the Swedish Krona SEK] and see it is extremely close to the USDX.

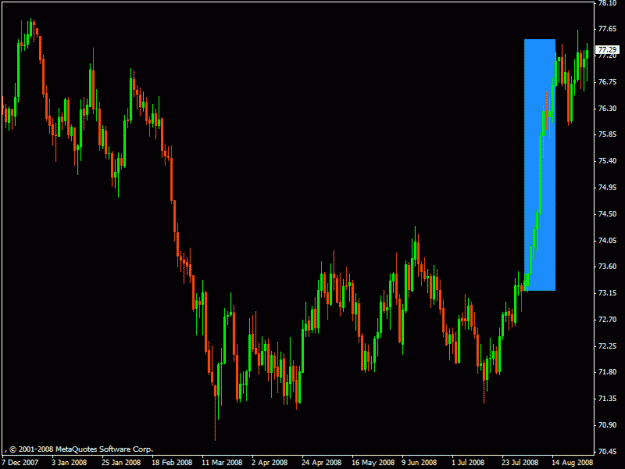
I would like to show you this USDX chart highlighting your recent winning period. Without trying to discourage you, many USD paired systems would have looked amazing in this period.

Dean.
Attached Image (click to enlarge)
Click to Enlarge

Name: 2.gif
Size: 17 KB
perception is reality
 
 
  • Post #288
  • Quote
  • Aug 31, 2008 2:02am Aug 31, 2008 2:02am
  •  tdion
  • Joined Nov 2005 | Status: EURUSD Quant FREAK | 3,197 Posts
Can we all agree that the market dictates any system's performance, and that every system will have hot, cold, and mediocre streaks?
 
 
  • Post #289
  • Quote
  • Edited at 2:19pm Aug 31, 2008 1:46pm | Edited at 2:19pm
  •  AgentFx
  • Joined Jun 2008 | Status: Resistance is futile | 349 Posts
Quoting tdion
Disliked
Can we all agree that the market dictates any system's performance, and that every system will have hot, cold, and mediocre streaks?
Ignored
Yes that is true...Agreed

By the way attended a rod booker seminar a few months back, and got to spend some time talking with him. He is smart and has some interesting views on the market.
It's me...
 
 
  • Post #290
  • Quote
  • Aug 31, 2008 6:31pm Aug 31, 2008 6:31pm
  •  disbellj
  • Joined Aug 2008 | Status: Member | 772 Posts
Dean,

Thank you for pointing that out to the others that view this thread, about the surge in USD strength that caused the winnings. I plan on trading a lower timeframe than daily (and maybe even lower than M30), but would need a dependable real-time indicator to do it. The only thing discouraging is my emotions. The indicator and what can be done with it are encouraging. An EA made with the fixed indicator could get past the emotion part. BTW, instead of "normalizing" the indicator by averaging, I simply add the gains or losses from each pair, selling non-usd-based pairs (so minus in front of those in indicator) and buying usd-based pairs. Since the Sentinal Index indicator averages, you can multiply the result from each swing by 6 to get how many pips would really be realized by buying USD or selling USD in those pairs - realtime. So this is not the NFP system I'm using, but using the same indicator with different moving average Period on different timeframe. Hundreds of pips could be made daily is what I'm seeing using 48 SMMA in M1 timeframe, if an EA was made or someone had the intestinal fortitude to trade 6 pairs each time. It's rough manually, especially having to manually update and playing on lower timeframe like M1.

Don


Quoting deanz
Disliked
Don you can find out what makes up the USDX at:
http://www.akmos.com/main/forex/usdx.html
you can input all these values into the idicator [except for the Swedish Krona SEK] and see it is extremely close to the USDX.

I would like to show you this USDX chart highlighting your recent winning period. Without trying to discourage you, many USD paired systems would have looked amazing in this period.

Dean.
Ignored
 
 
  • Post #291
  • Quote
  • Sep 1, 2008 5:33am Sep 1, 2008 5:33am
  •  deanz
  • Joined Nov 2005 | Status: Member | 113 Posts
Hey Don,

Sorry but I got some more "heads up" that took me ages to realize, if you are trading small time frames especially like M1 with these indicators, in Metatrader if price does not move a pip in the candle time frame you are using then metatrader may not display a candle, it just leaves it out, meaning on M1 time frame there may not be 60 candles an hour, so when the indicator goes and checks all the pairs it might not return with the correct values for every pair, and it gets worse when you try and show the indicator on a chart that does not have 60 candles on it but it is still trying to show 60 candles worth of data. Maybe Kevin knows how to correct this. On higher time frames this is not so much of an issue as price generally moves a pip :-)

Emotions, this may not apply in this case but it reminded me, here are 2 interesting interviews with Mark Douglas "Trading in the Zone"

Go here and in the left menu click on the 2 called Mark Douglas.
http://www.woodiescciclub.com/start.htm

Why not use the USDX and put a MA directly on that chat ?

Dean.
perception is reality
 
 
  • Post #292
  • Quote
  • Sep 1, 2008 5:57am Sep 1, 2008 5:57am
  •  Silver
  • | Joined Mar 2007 | Status: Member | 101 Posts
Kevin

Glad to see that you are back.

Looking forward to the new updated indicator.

Success in the new employment.

Regards
 
 
  • Post #293
  • Quote
  • Sep 1, 2008 6:15am Sep 1, 2008 6:15am
  •  Argo
  • | Joined Mar 2008 | Status: Member | 139 Posts
Hi All,

I've been using only one indi in my work Her it is: http://articles.mql4.com/422 It is still lagging like any other indi but gives you a very good picture of the market I think it is similar to what is being developed here would some of the coders hijackers have a look in the code and explain what is the difference? Hope this will help in future developments
 
 
  • Post #294
  • Quote
  • Sep 1, 2008 3:24pm Sep 1, 2008 3:24pm
  •  Kevin_E
  • | Joined Mar 2007 | Status: Member | 33 Posts
Quoting deanz
Disliked
Hey Don,

Sorry but I got some more "heads up" that took me ages to realize, if you are trading small time frames especially like M1 with these indicators, in Metatrader if price does not move a pip in the candle time frame you are using then metatrader may not display a candle, it just leaves it out, meaning on M1 time frame there may not be 60 candles an hour, so when the indicator goes and checks all the pairs it might not return with the correct values for every pair, and it gets worse when you try and show the indicator on a chart that does not have 60 candles on it but it is still trying to show 60 candles worth of data. Maybe Kevin knows how to correct this. On higher time frames this is not so much of an issue as price generally moves a pip :-)
...trunc...
Dean.
Ignored
Dean,

This is what I was getting at with that iBarShift talk. Somtimes, there may be a gap in time, so going back one candle at a time on all pairs may prove disasterous considering you're taking for granted the fact that they match up perfectly. The fix is easy, and I'm working on that right now, chances are I'll have the fixed version up before the end of our labor day weekend (by Tuesday).

I had an idea though...would it be easier on you all if I created a script that literally gives the Sentinal index its own chart (similar to the USDX picture posted a few back)? That way, not only can you put a moving average on it the same as suggested in the system, but you can put any indicator you want to on it to determine the USD pair based direction. It would go from being an indicator to being it's own symbol. If you like this idea and would like to see it, let me know..I've coded something similar to this recently and the code is straight forward.

-Kevin
Savage Pip Fiend
 
 
  • Post #295
  • Quote
  • Sep 2, 2008 12:26am Sep 2, 2008 12:26am
  •  disbellj
  • Joined Aug 2008 | Status: Member | 772 Posts
Kevin, I have had the opportunity to use a script. The problem I had with the script I used, was jumping into the trade when there wasn't enough pips to be gained to even pay for the set of trades, let alone profit (talking about lower timeframes, and really the script was tick-based, so lower than one minute, so too much of a microscopic view and not enough of a big-picture view IMHO). It would need to be like a currency chart, where one can look to the side of the chart to see how many pips the swings make up, so that one could look at potential of upcoming moves and better judge a certain distance up or down as a certain number of pips, and there could be a consistent correlation between them, e.g. 15 pips every quarter inch).

This would bring up why not just use the LiteForex Index (symbol USDLFX, which is the USD Index at Lite-Forex.org).

Which brings up the question what is someone attempting to do. The reason I don't use USDX is that I only want to track the currencies I would be trading. If I'm trading 6, I only want to track the P&L for those 6 if either buying USD or selling USD.

I would prefer an accumulation indicator myself like what is already made (without the averaging), just made to update realtime. Then hopefully EA after that. I've been working on it for months, but without indicator acting right (and I'm not a programmer really, struggling to learn anything I do), it's been a hard road. I just know in my thinking, this could be more profitable than other things simply because we're tracking the P&L values of multiple currency pairs, and in essence equity, by using one "equity" line and one moving average. Powerful. And not just because this indicator says so, because an indicator I built has said so, trading with it has confirmed, another indicator has been built that says so, and a script I've used has confirmed. USDX and other indexes for USD have also said so. But I don't want to track any currency pairs I'm not trading or are not available.

What do you think?

Don
 
 
  • Post #296
  • Quote
  • Sep 2, 2008 12:33pm Sep 2, 2008 12:33pm
  •  disbellj
  • Joined Aug 2008 | Status: Member | 772 Posts
I posted this from gmail account a couple hours ago. Since it hasn't come through to this thread in a couple hours time, I figured it got lost somewhere. So I replied here instead of through email. So if it gets posted twice, sorry.

Dean,

I don't use USDX because I'm looking for an accumulation indicator,
with either 0 (not used) or 1 (used) weighting for each pair. No need
for more complicated math in my approach. In fact, more complicated
math would work against me.

To do this in the Sentinal Index indicator, I simply remove the lines:
x += -NZD * Sentinal("NZDUSD",i);
x /= (EUR+JPY+GBP+CHF+CAD+AUD+NZD); // FIXME: incorrect if a pair is
not available

When I do this, I am removing NZD being used in calculation, and I
remove averaging, so that I get true P&L of buying 3 pairs and selling
3 pairs at the same time.

I need real hard numbers of P&L for each pair I want to trade, added
together to form one P&L line. If monetary value of pips are added,
then this becomes an equity indicator. It tells if I would be making
money or losing money. I would rather put a moving average on equity,
which looks at all trades as one, and gets to the "bottom line". And I
must know that the calculations are using only the pairs I want to
trade, with the simple math that's used in the present indicator, with
minor changes.

I realize this is different than what has been done before, but I can
easily change the fixed NFP indicator to be suitable for my needs, as
noted above. Emotions are one thing to overcome, but I can't do that
when I know the indicator is not trustworthy on the timeframe I'm
playing.

Don
 
 
  • Post #297
  • Quote
  • Sep 2, 2008 3:20pm Sep 2, 2008 3:20pm
  •  disbellj
  • Joined Aug 2008 | Status: Member | 772 Posts
Found this on the net:

USDLFX = SQR ((USDCHF * USDJPY) / (GBPUSD * EURUSD))

So we see that it's not a simple addition of P&L of multiple currencies, like we have in the Sentinal Index indicator (if averaging is removed). It seems everything besides this indicator (and if using averaging, even this indicator) uses more complicated math to give a USD value. Every one of them overlooks trying to trade multiple currencies, so none merely adds P&L like could be done to see true potential.

Don
 
 
  • Post #298
  • Quote
  • Sep 3, 2008 3:14pm Sep 3, 2008 3:14pm
  •  disbellj
  • Joined Aug 2008 | Status: Member | 772 Posts
Kevin,

After looking at the USDLFX M30 chart, and using MACD on it, it looks good. The problem with that chart is that it is only using four pairs. Being able to choose which pairs to use would be great. So whether you fix the indicator, or choose to do a script, either will be appreciated. You're right though, the script would allow us to use other indicators of our choice on it, and I think you got a great idea there.

Thank you,

Don


Quoting Kevin_E
Disliked
Dean,

This is what I was getting at with that iBarShift talk. Somtimes, there may be a gap in time, so going back one candle at a time on all pairs may prove disasterous considering you're taking for granted the fact that they match up perfectly. The fix is easy, and I'm working on that right now, chances are I'll have the fixed version up before the end of our labor day weekend (by Tuesday).

I had an idea though...would it be easier on you all if I created a script that literally gives the Sentinal index its own chart (similar to the USDX picture posted a few back)? That way, not only can you put a moving average on it the same as suggested in the system, but you can put any indicator you want to on it to determine the USD pair based direction. It would go from being an indicator to being it's own symbol. If you like this idea and would like to see it, let me know..I've coded something similar to this recently and the code is straight forward.

-Kevin
Savage Pip Fiend
Ignored
 
 
  • Post #299
  • Quote
  • Sep 4, 2008 12:41am Sep 4, 2008 12:41am
  •  deanz
  • Joined Nov 2005 | Status: Member | 113 Posts
Quoting disbellj
Disliked
Found this on the net:

USDLFX = SQR ((USDCHF * USDJPY) / (GBPUSD * EURUSD))

Don
Ignored
Hey I tried that formula......... it did not work for me.......... no matter where I placed the decimal point on the USDJPY.

Although at first look it appears so, but this line does not do averaging.

x /= (EUR+JPY+GBP+CHF+CAD+AUD+NZD);

make an indicator with it in and one without, I think you will not be able to tell the difference in the actual indicator lines. The values in the vertical scale will change but not the line itself.

You can choose what pairs you want to include/exclude in my indicators by...... like you request, placing a 0 or a 1 in the input tab next to the currency, [or any value you like if you only want it to partly influence the indicator]


Dean.
perception is reality
 
 
  • Post #300
  • Quote
  • Sep 4, 2008 1:56am Sep 4, 2008 1:56am
  •  deanz
  • Joined Nov 2005 | Status: Member | 113 Posts
Don I finally figured out what you are meaning when you say P&L, and that being you trade a basket of currency pairs, and have the indicator only show the combined direction of those basket of pairs. I like the idea. But how do you know when the indicator is going to go up or down, this is what I have been trying to work out for over a year with these indicators, you think to buy the dips when it is rising only to find the low of the dip just got broken. It is kinda like placing a MA on a chart, making the candles invisible and then trying to trade the MA, you just never know when it will turn. But I hope you can prove me wrong :-)

It's easier, although not easy, to look at a candle chart of those basket of currencies [ USDX EURX ] and apply your trading technique to that, for when price hits a lever and retraces you can actually make a bit of sense of the chart and see if it was a Support or Resistance level....... etc, so if Kevin can make a script to display a self make basket of pairs viewed as a candle chart, then that would be interesting.

Dean.
perception is reality
 
 
  • Trading Systems
  • /
  • NFP System - Backtest data provided
  • Reply to Thread
    • 1 1314Page 151617 20
    • 1 14Page 1516 20
0 traders viewing now
  • More
Top of Page
  • Facebook
  • Twitter
About FF
  • Mission
  • Products
  • User Guide
  • Media Kit
  • Blog
  • Contact
FF Products
  • Forums
  • Trades
  • Calendar
  • News
  • Market
  • Brokers
  • Trade Explorer
FF Website
  • Homepage
  • Search
  • Members
  • Report a Bug
Follow FF
  • Facebook
  • Twitter

FF Sister Sites:

  • Metals Mine
  • Energy EXCH
  • Crypto Craft

Forex Factory® is a brand of Fair Economy, Inc.

Terms of Service / ©2022