DislikedThese spreadsheets are spectacular. I hope you had a quick way to put them together. I had programmed an EA very similar to this method a week ago, but couldn't get steady results. It looks like you've used a considerable amount of variables here, perhaps that was my problem. I think this has given me some more hope that this method can be consistent.Ignored
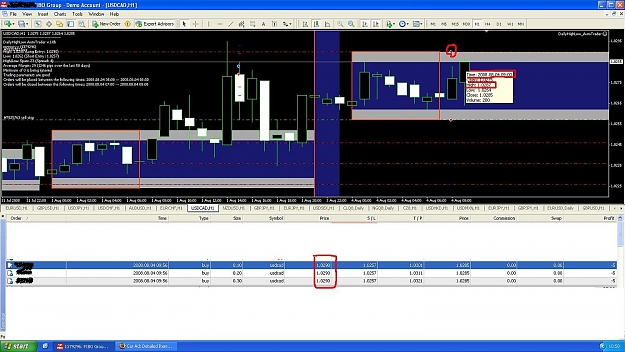
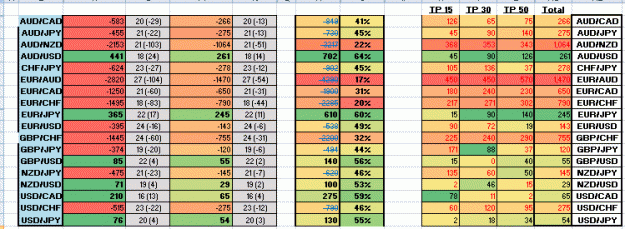
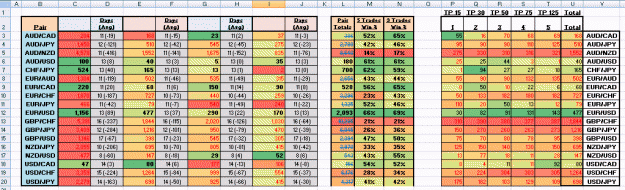
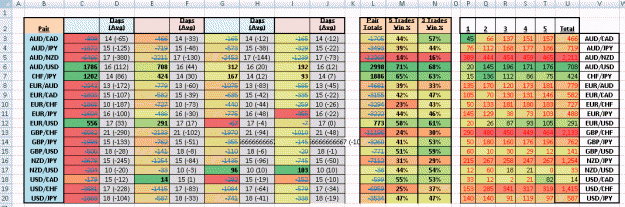
Thanks for the compliment. Nothing I do ever stays quick for long. I'm a statistics maniac so when I started working an Excel workbook into what I wanted, it got crazy very quickly. It's several sheets that all have their own subtotals and some other calculations. What you're looking at above is the main sheet that shows all those results compiled into something that's easier to look at to get the big picture. Behind the scenes are all of the actual trades (complete history with comments) that build the end data copied and pasted from the HTML statements and formatted.
My largest Excel workbook with the completed history is over 22.7 MB and takes around 30 seconds to open on a dual core computer with 4 GB of ram. It takes slightly longer to save. The 5 trade histories have 6,446 actual trades that were triggered times 2 sheets (multiple lots/single lots) and 3,902 3 trade history times 2 sheets.
Remember when looking at those spreadsheets that numbers with the strike through them and red numbers are negative. You can see that the numbers are very large because they have been crunched for months. This does not discourage me at all because some of the numbers are still positive and large as well. This has shown me which currencies are doing well under those settings and now allows me to test other settings to see which ones do better there as well.
I always test all pairs knowing that some will be bad and some will be good and sometimes it may surprise you to see which ones they are. I had 7 copies of MetaTrader running on my computer for all of those months just to get those numbers but in the end I think it was worth it.
QuoteDislikedBefore I go off to program this again, has the most recent version changed very much from the original concept? Are you using any other chart information besides the high/low from a specific time range? I think you mentioned somewhere that it gets averages from over 50 days in the history...which seemed strange... so please let me know if you're using another additional strategy.
Overall, great results, looks like you've put in some hard work here. Good luck, I'll be following your progress.
Thanks