hey lilmoe, don't you think we will have a %100 fib retrace before up?
I agree with you that cci is OS but cci can stay under -100 level for a long time.
Because of the way GU is moving down so seroiusly right now and as I don't see any bounce or divergence yet in highr TF's, I believe we will see 1.9350 - 70 area before GU resumes it's uptrend again.
This will push GJ down to 209 levels or so and I think if UJ contributes they will push it to lower levels.
Right now I'm waiting for Fed to see what they will do to this ...
Ignored
yes i agree... i don't think cable will stop at 1.9350 this time, i think it should go 200-300 pips lower than that before it resumes any uptrend. however, i'm not trading the resumption of the uptrend at the moment, i'm trading a bounce
I have to say it's is little bit strange for me to hear this from you and Q.
Q said GJ is OverSold. I see that trend line on daily chart too and I know it is a tough sup but sitting on a trend line doesn't mean to me it is OS.
I said that based on indicators like Stochastic and CCI. It has plenty of room to go down as a matter of not being OverSold because I see CCI is leaving level 100 to the down side after such a clear bearish divergence.
In fact it is exiting Overbought area to start it journey down as shown on daily chart.
JMVHO
Ignored
strange, CCI 50 isn't showing a crossing of the 0 line on my platform...
Given the weekly double top and the bearish divergence in the RSI, the bearish sentiment should continue throughout the week. This means Eur/usd will probably close underneath this weekly trendline.
EU will touch 1.5420/30's and lower (1.5399 area) shortly so it's been a sell on any rallies, the same with GU, these two pairs are headed for the crapper. . . Wouldn't try longing them as they have broken thru some significant support and look to continue south my friend. . .
with gas prices falling and $ strength, EU/GU will be short trades for me until I see them get back above significant support - EASY $$$$$!
Ignored
I tend not to agree on this. Fed is not hawkish enough. Market has priced in at least 25 bps hike or more for EU to trade down to current level. Thus, with Fed rate stays the same, we would see a lot of shorts covering coming in the next sessions. I am looking to 1.57xx before slowing it down .. imo ..
look at this picture. it shows a hidden bullish divergence on h4, which as you know it is a continuation pattern.
so unless we see the daily trend line broken, we must assume the trend is intact and buy dips.
I have to say it's is little bit strange for me to hear this from you and Q.
Q said GJ is OverSold. I see that trend line on daily chart too and I know it is a tough sup but sitting on a trend line doesn't mean to me it is OS.
I said that based on indicators like Stochastic and CCI. It has plenty of room to go down as a matter of not being OverSold because I see CCI is leaving level 100 to the down side after such a clear bearish divergence.
In fact it is exiting Overbought area to start it journey down as shown on daily chart.
Guys, I stated on 17.07.08, I will NEVER ever forget, when I
see a hammer above the ichimoku cloud (and also rejected from ema150).
I mean: money. BIG money.
Ignored
we may be looking at a correction but it won't last, the highest it may go and that's a big if is another 100 pips or so. The downtrend must play itself out before a reversal. I'm still betting on a sell to atleast the lower parts of today's move.
look at this picture. it shows a hidden bullish divergence on h4, which as you know it is a continuation pattern.
so unless we see the daily trend line broken, we must assume the trend is intact and buy dips.
I have to say it's is little bit strange for me to hear this from you and Q.
Q said GJ is OverSold. I see that trend line on daily chart too and I know it is a tough sup but sitting on a trend line doesn't mean to me it is OS.
I said that based on indicators like Stochastic and CCI. It has plenty of room to go down as a matter of not being OverSold because I see CCI is leaving level 100 to the down side after such a clear bearish divergence.
In fact it is exiting Overbought area to start it journey down as shown on daily chart.
JMVHO
Ignored
mm let me see dj screaming up today .... maybe carry trades will assume risk once more
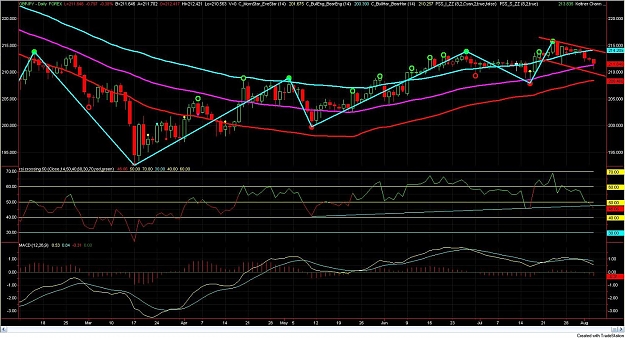
Here is daily ... higher lows = bullish uptrend simple as that
If swing trading buy the dips is safer till 50 sma on daily broken
we may be looking at a correction but it won't last, the highest it may go and that's a big if is another 100 pips or so. The downtrend must play itself out before a reversal. I'm still betting on a sell to atleast the lower parts of today's move.
Good Luck
Ignored
a hammer above a few serious resistances (ichimoku cloud, ema150, fib confluence) at the end of a downtrend:
I tend not to agree on this. Fed is not hawkish enough. Market has priced in at least 25 bps hike or more for EU to trade down to current level. Thus, with Fed rate stays the same, we would see a lot of shorts covering coming in the next sessions. I am looking to 1.57xx before slowing it down .. imo ..
Joined Sep 2007
|
Status: gone fishing
|5,782 Posts
Bears vs Bulls...Whoos gonna win? Price now touched the descending channels UTL and looks like it wants to bounce south, but the tentative rising/ascending TL still holds the price inside this downtrend channel. Im on the sideline untill i see a clear break. If price breaks tentative TL incl. DP (near same price) as well, so this secures my short position and i might jump in for a ride to the southside. Though i hate trading during time like this LOL
Bears vs Bulls...Whoos gonna win? Price now touched the descending channels UTL and looks like it wants to bounce south, but the tentative rising/ascending TL still holds the price inside this downtrend channel. Im on the sideline untill i see a clear break.
Ignored
The best way to see whether it is bulls or bears at this time is looking at QQE 1hr.