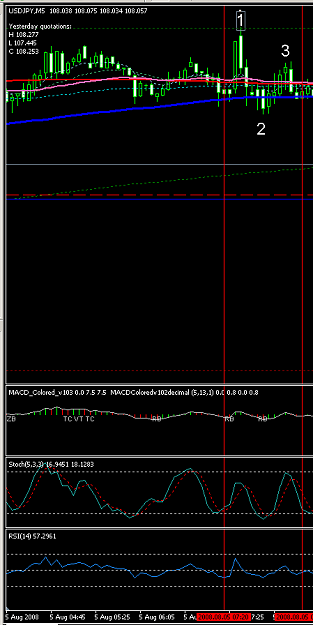
All right, lite27. Thank you for your attention and questions. The 123 pattern on E/J daily chart is here. And you can see RSI 14 < 50 on daily chart now
http://picnac.com/images/2151ej050808c.gif
Check weekly chart - sthochastic 40,3,3 is crossing down, ok.
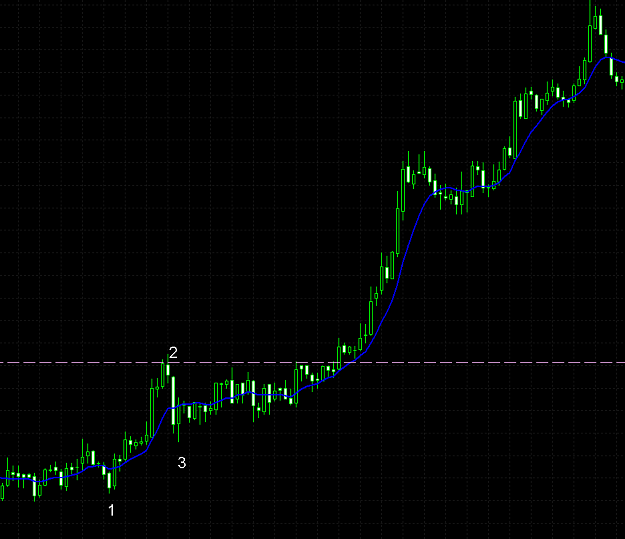
we have in mind that E/J has reversed. All we have to do is seeking a good point of time for entry. Just move to a lower TF (H4) and wait for price to cross down 50 EMA again. As you can see, everything happened exactly as what we waited for...
http://picnac.com/images/2151ej050808c.gif
Check weekly chart - sthochastic 40,3,3 is crossing down, ok.
http://picnac.com/images/4872ej050808d.gif
we have in mind that E/J has reversed. All we have to do is seeking a good point of time for entry. Just move to a lower TF (H4) and wait for price to cross down 50 EMA again. As you can see, everything happened exactly as what we waited for...