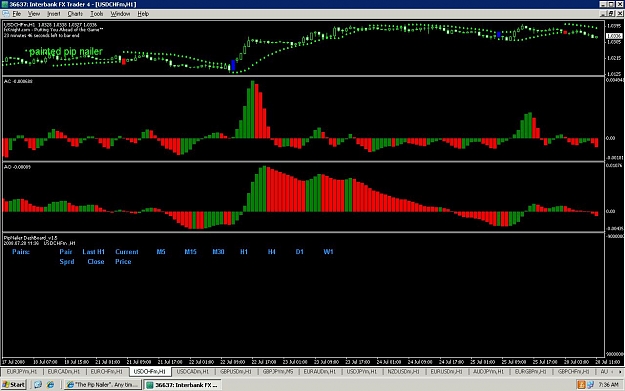
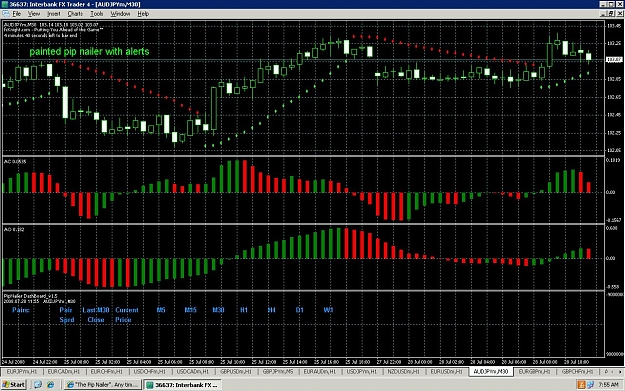
DislikedLet's me know is it I'm setting this up correctly. I have gone thru this whole thread for the second times. What i wish to get now is the signal line. Whereby i saw on others charts, you all having a long straight line when the AC OC and PSAR change together. While in my charts, mine is a whole blue line on the candle.
Juz fix me if i did any mistake on the charts, I gonna try this out as sooon as i get confirmation from you guys.
Sorry cause i wont be participating in EA stuff, cause i not really get used to EA, mroe prefer on manual trading. Anyways, well done on the EA, there is too many EA version as i saw in this thread.Ignored
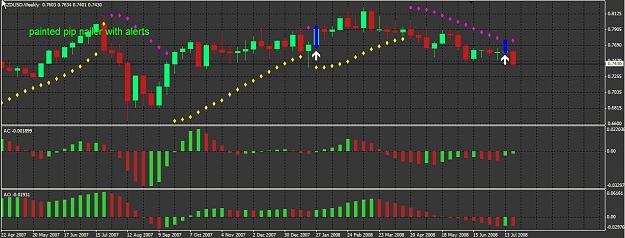
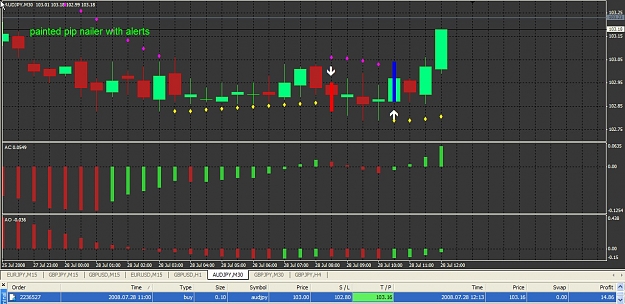
 "The Pip Nailer". Any time frame, any pair
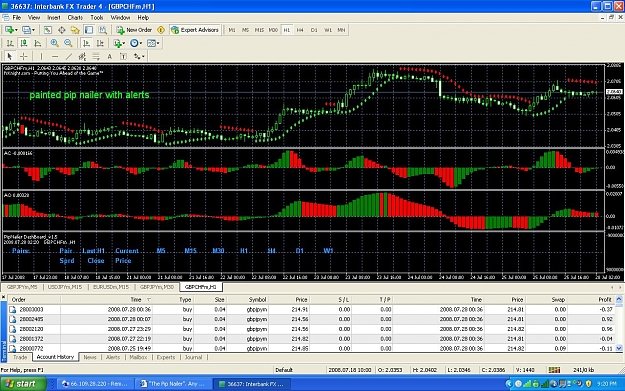
- #1,049
- Edited 12:28pm Jul 24, 2008 4:36am | Edited 12:28pm
- | Joined May 2008 | Status: Trader | 1,245 Posts