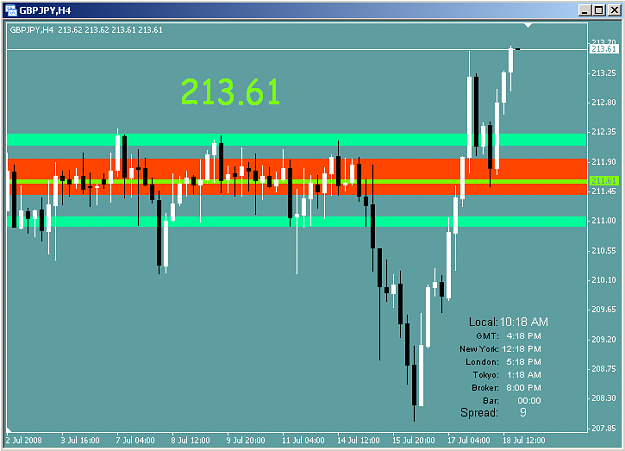
Here's an indicator I haven't seen around here. Not sure it can be done for MT4 or not, with the way it handles arrays... but basically it's this.
Input: Number of minutes
Go down to the M1 and loop back thru the input number of minutes, and for every time a price appears within a bar (between high and low, inclusive) you increment a count for that price (within an array). Repeat thru all input bars.
This gives you a count of the number of bars that contained a specific price over the last X minutes (or hours, or however long) allowing you to clearly see areas of congestion for a specific price. For instance an index over 20 would mean a relative area of support or resistance versus an area of 0 or 1, which would indicate practically none.
Use either as an indicator that paints areas based on index (green for low, orange for mid, red for high, whatever) or as use in a trend following system to not take trades while still in a tight range.
Anyone think they're up to the challenge?
