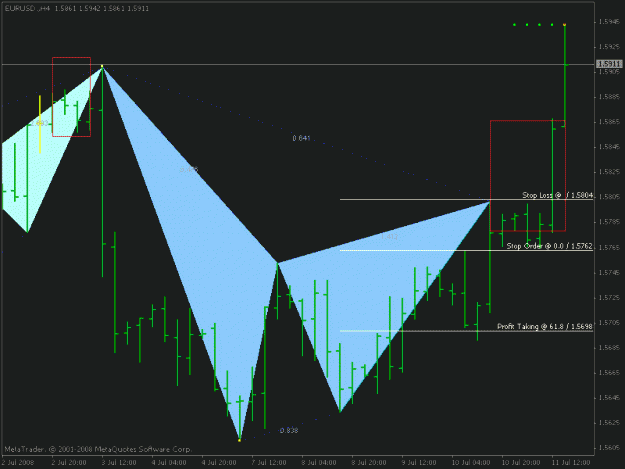
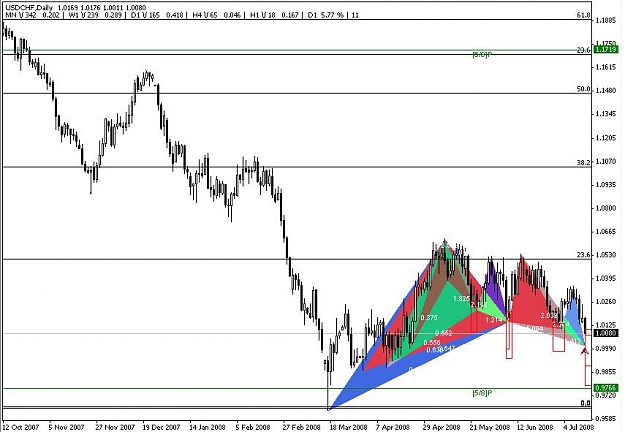
I've got a few charts to show today my first one is the 127 AB=CD trade hopefully some of you got. As you can see it bounced off the back side of the crossed trend lines at a 618 fib and went to the 1618 extension, a realy good pick up if you got it. I however missed it.
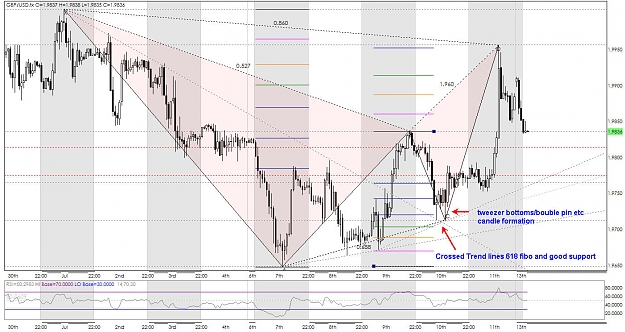
Not to worry though I had a good Idea where it was going to go. In a past chart I showed that the Bat pattern completing at the 886, the same thing happened again on friday night, As B only went to the 50 fibo and not the 618 you can expect a deeper CD leg instead of the 786 it tends to go to the 886. So I just waited, and sure enough as you can see in my next chart a 127 AB=CD has completed, 1618 extention reached, and the 886 reached (well almost, but close enough) and all converging in the same area. so where's the candle to enter off? well that was on the 15 and 30 minute charts. (my 3rd chart) shows a Shooting Star type formation. or Pin whatever you want to call it.
Anyway I place a Limit entry order to enter at 19945, my stop 10pips + the spread above high of candle at 19970. my first limit above the 382 of the CD leg at 19865 (80 pips), my second at 19815 (130pip's) Just above the 618/50 convergence of CD and AD then my final limit just above the 618 of AD at 19775 (180 pips).
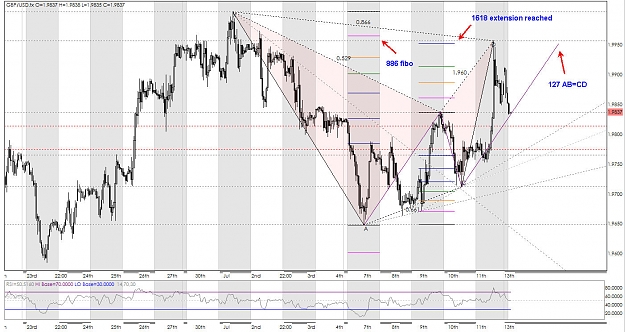
as you can see my first limit has been reached, so I move my stop to Buy in, (never let a winning trade become a loosing one), and yes my last trade was stopped out at buy in, but not before I secured 50 pips at my first limit so I still bagged some.
If I get it wrong or miss a trade I move on, and look for the next opportunatey.
Good trading All
PS. The squiggly line beneath each of my charts is RSI I have them set at 70 and 30%, in each chart you will notice that it has gone above 70% letting me know it is over bought, I use this as to add to my annalysis, not as a reason to place a trade.
Does anyone know if the ZUP indicator can be used with the vhands trading simulator. Also, why do I have to close and restart metatrader when I add the indicator to the charts. When I first add the indicator it's almost as if it doesn't attach but if I close and reopen mt4 the chart shows up with the patterns. This also happens when I swtich from D1 to H4. If I switch time I have to close and reopen mt4.
Also, why do I have to close and restart metatrader when I add the indicator to the charts. When I first add the indicator it's almost as if it doesn't attach but if I close and reopen mt4 the chart shows up with the patterns. This also happens when I swtich from D1 to H4. If I switch time I have to close and reopen mt4.
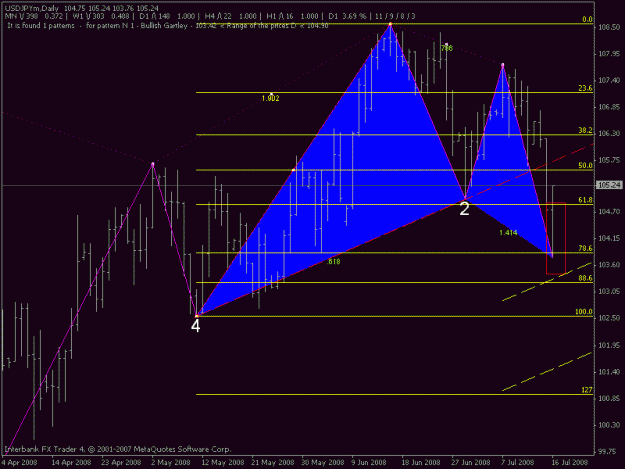
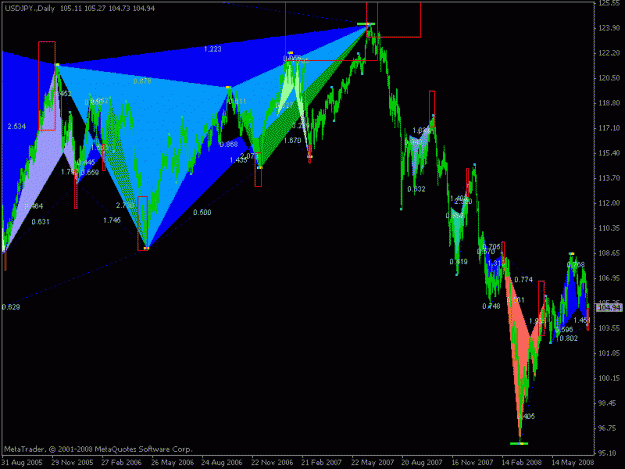
Also, I started watching your pattern on the USDJPY last night. Todays candle hit the 78.6 retracement of the X and A within 10 pips on my charts. This is the first time I have been experienced to the patterns and that is kind of freaky. How often does that happen? I have attached a screen shot in case I'm explaining it wrong. Would the target now be the 61.8 of CD?
Right now I'm only focusing on the Gartley bullish and bearish patterns and the AB=CD. I also only have time to monitor the daily charts and I'm wondering how often are these signals generated.
Edit - I'm also a huge fan of Prison Break. I can't wait for the new season to start.
Ignored
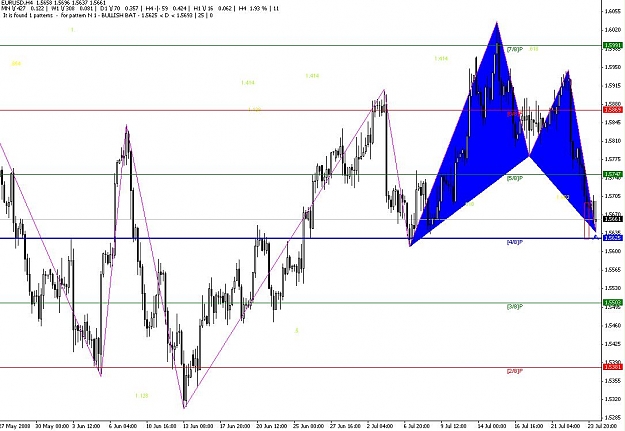
I found about 14 patterns since July 2005.
61.8 of CD considered as an initial profit.
Try ZUP setting on page 7 post #103 to reappearing the past patterns.
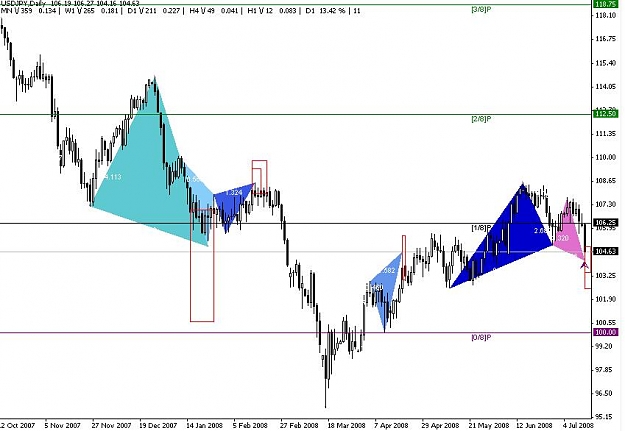
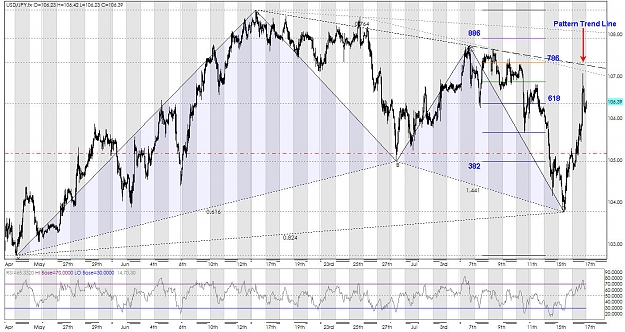
Hi all there was a Bigger Gartley pattern at play on the JPY that pushed it longer. If you look at my chart you can see the Big Gartley. If you go on this one it a good first limit would have been the 382 fibo at 104.95 then a second at the 618 at 106.35, and if you had a third limit I would be setting it above the Pattern down Trend Line or run a trailing stop from the 382 to your entry point and run risk free as if it does exceed the trend line, you can capitlalise on the move and let the market take you out or get out when you see another reversal, if you utilize this type of strategy other areas you would monitor ar the 786, 886, 1.0, 127, etc.
This stragey is defined in Scott Carneys Book, and would have been an excellent choice in this trade.
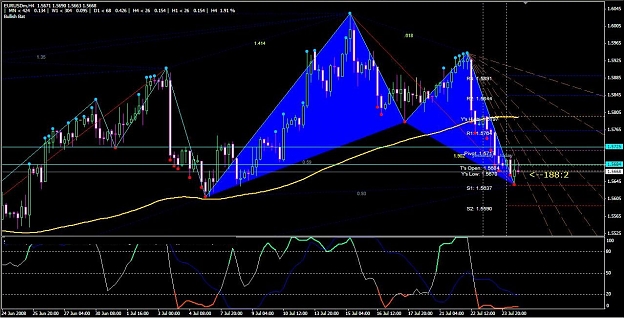
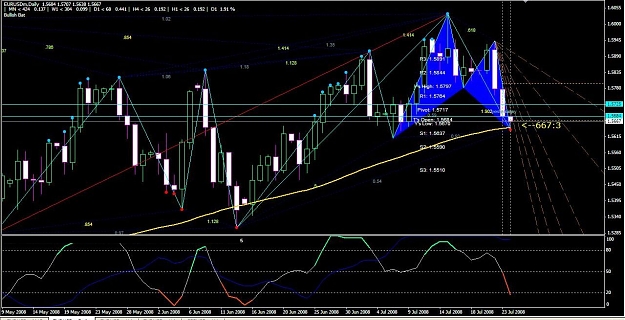
EURO GBP, CHF falling heavily, they are all in oversold territory.Bullish Gartley developing in the charts there should be a reaction .I think technically US markets will start falling soon but I am not quite sure if it is going to be the correction of current reaction or it is going to be the end of current reaction.We will see.
EUR/USD--The current up-trend could be changing cause Bullish Gentley H1 ,H4 and Daily Very clear now and moving into a trading range Sidelines Mode. The move below Daily Pivot 1.5717 .FX trader are advised to wait for a clearer signal before entering the market on this one
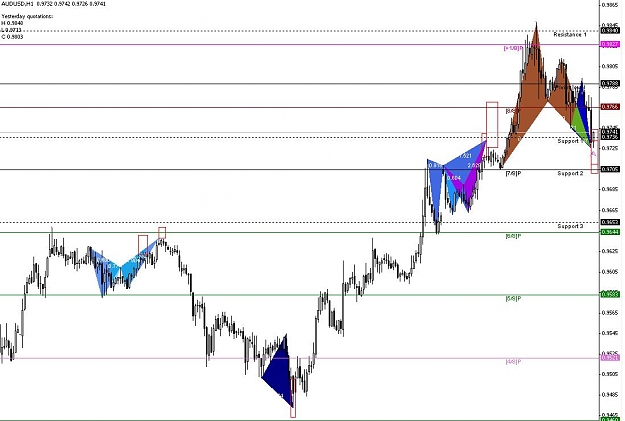
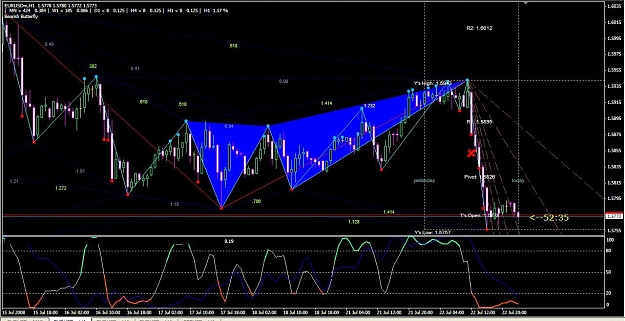
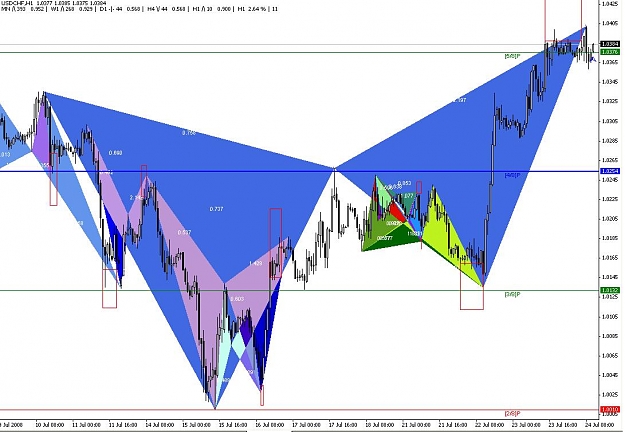
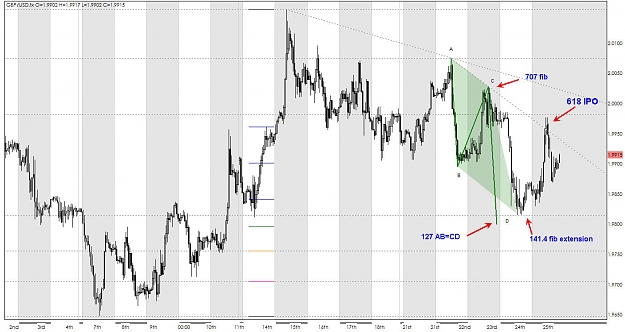
As your charts above show the Bullish Gartley type patterns, I thought I'd show another take a simple 127 AB=CD pattern the reached the 618 initial Profit Objective last Night (IPO).
It shows the 707 fib retrace and then the move to the 141.4 extention which is close enough to the 127 AB=CD and the reversal straight to the 618 at the pattern trendline.
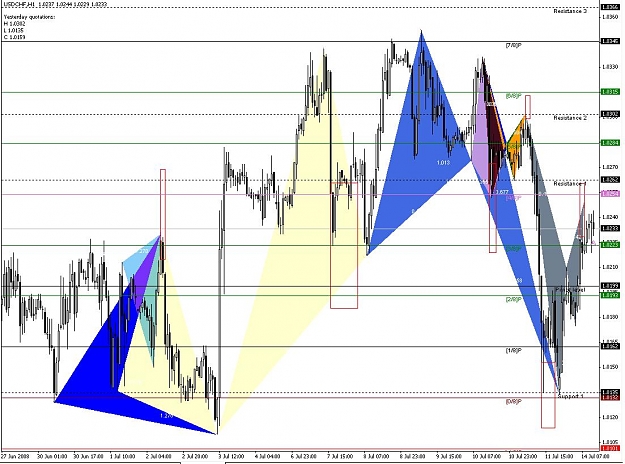
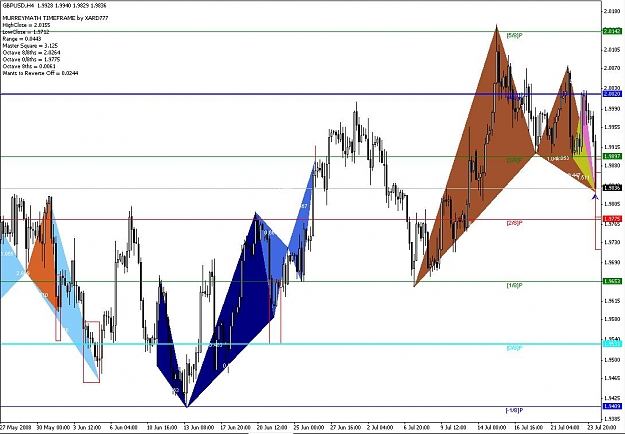
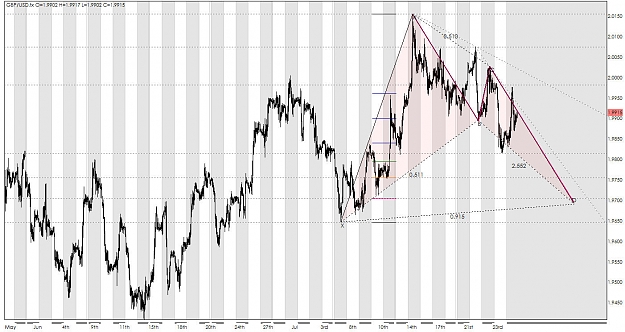
I like the look of some further downside movement on the GBP to form a bullish bat pattern at the 886 @ 19705, and also see the potential for is to reverse at the 786 @ 19760, before going to the 886. Only time will tell whether this pattern will play out.
"To find the harmonic or vibratory number in a stock or market...find the common swings using length, or in terms of points, that recur over and over... using a 30-minute chart as an example, the easiest way to find the harmonic numbers is to look for an mark in (such as with a line drawing tool) the most common or repetitive swings" (28)
These common swings can be used to help determine pattern completion points and profit targets. Is there an indicator that will find these repetitive swing lengths automatically? or do I have to go through each chart and do this by hand?
Ignored
there is one in this thread that works on meta trader called Zup, other than that you can do what I do and use Fib retracement and extention levels I scan for these myself and have developed an eye for the different patterns, I do struggle on some of the patterns within a pattern but I generally trade from the 1Hr, Daily, and 4Hr, I use the smaller time frames to find entry signals If I can't find on on the time frame I'm trading
there is one in this thread that works on meta trader called Zup, other than that you can do what I do and use Fib retracement and extention levels I scan for these myself and have developed an eye for the different patterns, I do struggle on some of the patterns within a pattern but I generally trade from the 1Hr, Daily, and 4Hr, I use the smaller time frames to find entry signals If I can't find on on the time frame I'm trading