• Home
  • Forums
  • Trades
  • News
  • Calendar
  • Market
  • Brokers
  • Login
  • Join
  • User/Email: Password:
  • 12:44pm
Menu
  • Forums
  • Trades
  • News
  • Calendar
  • Market
  • Brokers
  • Login
  • Join
  • 12:44pm
Sister Sites
  • Metals Mine
  • Energy EXCH
  • Crypto Craft

Options

Bookmark Thread

First Page First Unread Last Page Last Post

Print Thread

Similar Threads

Monte Carlo System Simulation Spreadsheet + Discussion 4 replies

Monte Carlo Simulator 2 replies

monte carlo simulation 3 replies

On the purpose of Monte Carlo methods in trading 12 replies

System Expectancy - Monte Carlo Simulation 5 replies

  • Trading Discussion
  • /
  • Reply to Thread
  • Subscribe
  • 4
Attachments: Monte Carlo w/ your money management
Exit Attachments
Tags: Monte Carlo w/ your money management
Cancel

Monte Carlo w/ your money management

  • Last Post
  •  
  • 1 Page 2
  • 1 Page 2
  •  
  • Post #21
  • Quote
  • Jul 1, 2008 8:55pm Jul 1, 2008 8:55pm
  •  hanover
  • Joined Sep 2006 | Status: ... | 8,092 Posts
Quoting tdion
Disliked
i don't think i've done a good job of explaining the idea

obviously this thread has nothing to do with how to obtain green pips... the focus is on maximizing those green pips when (or if) they come....
Understood

the first graph is profit/loss in terms of pips.
Yes, this is effectively fixed position size

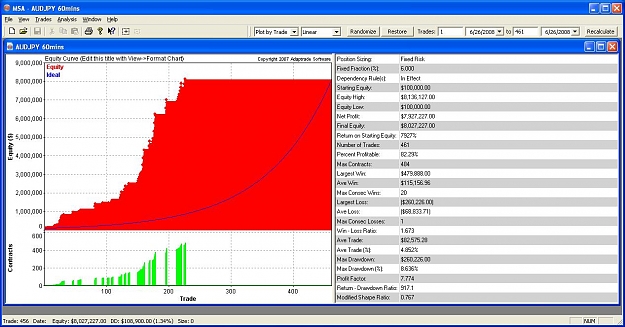
the second graph is elevating the risk once a certain percent has been achieved (the "house money" as i like to call it...)
This is a kind of anti-Martingale (although nowhere near as severe as doubling up following each win). After enough wins have occurred, causing equity to reach a certain value, the bet size increases, putting wins and losses on an equal weighting. But then when enough losses occur, at the larger bet size, the bet size is reduced, so the subsequent recovery rate is impeded. Look at the green histogram in relation to the wins and losses in the equity curve, and you will see this effect. Immediately the blue curve falls sufficiently, the green histogram falls also.

the third graph is a slow and steady increase in risk as the account grows
Yes, this will work fine as long as the account continues to grow. But the increased risk means bigger losses when if / when trading conditions no longer favor the system. In other words, the early trades (when position size is low), are recieving lower weighting. IMHO there needs to be a reason to justify this, i.e. why these trades are less likely to be profitable.

here's the point of the entire thread: trade 1/2 the account as demonstrated with the first MM and 1/2 the account as demonstrated w/ the second... the end result would have been +300% on the year (1/2 of 600%)....
I assume that by the first MM you're referring to post #3, and the second is post #4?

there are years when the 1st MM would have made several thousand percent for me.... so it is definitely worth considering trading that way, even with a small percentage of my account.... and supposing i did risk 1/2 my account, +300% would look very small compared to a few thousand %
The anti-Martingale will perform exceptionally during a winning streak, because you're effectively increasing your bet size as the winners roll out. (It's akin to pyramiding your trading positions during a prolonged trend). But then any losses are also subject to the increased bet size, so a sudden losing streak will just as quickly undo all of the good work. Then you have the problem of the slow recovery rate, which is where I assume that your MM in post #4 (on the separate account) is designed to compensate.

to do what i am saying, you'd need two different accounts, completely isolated from one another
Ignored
Hopefully I did understand, albeit at the second attempt (hence the addendum to my original post).

Not quite sure what I'm missing........??

Also:
What is your profit factor?
How many trades in your sample size?
What is the win rate?

David
 
 
  • Post #22
  • Quote
  • Jul 1, 2008 9:05pm Jul 1, 2008 9:05pm
  •  tdion
  • Joined Nov 2005 | Status: EURUSD Quant FREAK | 3,197 Posts
hi david

the results vary from year to year... my sample size is about 900 trades spread between 9 different setups over 8 years

the "anti-martingale" is really just fixed fraction! instead of wimpy 2%, why not consider 15% per trade? but only do this after you are up about 25%... that way, you can turn down the risk if it starts eating into your original capital (see post 3)

i never posted charts where the fixed fraction of 15% did well, but lets just say it is a few thousand percent in a year.... you are correct when you say it will "undo the good work" in a losing period.... so either you:

A) remove profits after achieving X percent
B) remove profits if you draw down X percent
C) remove profits at the end of X time period

as you said, recovery after drawing down with fixed fraction of 15% can take awhile... BUT... if you truly have an edge, it will come back soon .... just look how many "failures" were in post #3.... it had many chances to take off

i actually look at it as an airplane trying to get off the ground... and when it soars, watch out buddy!
 
 
  • Post #23
  • Quote
  • Edited 10:17pm Jul 1, 2008 9:17pm | Edited 10:17pm
  •  pippero
  • | Joined Oct 2007 | Status: Trend following is for teens | 216 Posts
Quoting Craig
Disliked
You are taking the piss aren't you?
The Kelly formula will lead to risk sizes that will kill you real quick on string of losers.

Anyway, back to the topic of the thread, check out this http://hquotes.com/tradehard/simulator.html, it's an eye opener.
Ignored
wow, that's a nice applet. Did it scare you? even with a win probability of 0.5 and a W/L ratio of 1.1 (which you have to admit is quite lame) it never went broke over 1600 tests. Sure you get 20 or so cases of 50% drawdown, but having the stomach to weather drawdowns is what trading is all about (well, almost.)

using kelly's formula will correctly lead you to lower your risk during drawdowns, i dont see how that can hurt. you talk of it like it's a martingale!

I've applied it to some system that has positive expectancy and it improved it a lot. Sure drawdown was 10 times as big, but profit was 20 times bigger..

I think it's not as bad as you paint it. I've read of some professional quants using it conservatively by dividing the suggested risk by half, maybe that can be a good idea if you feel conservative.

Of course, it helps if have a very large number of trades you've backtested on, so that you can be more sure of the ratios and probabilities you're putting in. But I see tdion's system has taken 168 over a few years, that's not insignificant statistically speaking.

Maybe he could run the same system over more pairs, find out the one that gives the worst results and then average the best and worst ratios and probs and then put that into kelly's... just an idea.
 
 
  • Post #24
  • Quote
  • Edited 11:30pm Jul 1, 2008 9:58pm | Edited 11:30pm
  •  tdion
  • Joined Nov 2005 | Status: EURUSD Quant FREAK | 3,197 Posts
i only posted 2003 trades.... there are over 900 in my full backtest

i despise kelly for forex... mostly because i don't believe that non-scientific edges (those without identifiable 100% quantifiable cause/effect relationships) can be given an expectancy

tell me, what is the probability of a double top or head and shoulders going any direction? what is the payoff? it is ridiculous..... some years it could be 60%, other 30%....

nope, sometimes you have to flip conventional thinking upside down, and come up with radical new concepts. i doubt i have ever been the inventor of any trading idea though.... the problem space is relatively small, and easy to exhaust by people willing to put the time in....

Quoting pippero
Disliked
Of course, it helps if have a very large number of trades you've backtested on, so that you can be more sure of the ratios and probabilities you're putting in. But I see tdion's system has taken 168 over a few years, that's not insignificant statistically speaking.

Maybe he could run the same system over more pairs, find out the one that gives the worst results and then average the best and worst ratios and probs and then put that into kelly's... just an idea.
Ignored
 
 
  • Post #25
  • Quote
  • Jul 2, 2008 4:14am Jul 2, 2008 4:14am
  •  hanover
  • Joined Sep 2006 | Status: ... | 8,092 Posts
Quoting tdion
Disliked
.......
the "anti-martingale" is really just fixed fraction! instead of wimpy 2%, why not consider 15% per trade? but only do this after you are up about 25%... that way, you can turn down the risk if it starts eating into your original capital (see post 3)......
True enough, but remember that every time you turn down the risk, you decrease the immediate return; and vice versa. Since you prefer to play with the house's money, then that's fair enough. Cold statistical aspects aren't necessarily the only ones; there's no reason why MM shouldn't also incorporate personal and lifestyle considerations.

i never posted charts where the fixed fraction of 15% did well, but lets just say it is a few thousand percent in a year.... you are correct when you say it will "undo the good work" in a losing period.... so either you:

A) remove profits after achieving X percent
B) remove profits if you draw down X percent
C) remove profits at the end of X time period
Removing profit = decrease in account equity. Using fixed fractional, that equates to smaller position size. Again, lower risk = lower return.

as you said, recovery after drawing down with fixed fraction of 15% can take awhile... BUT... if you truly have an edge, it will come back soon .... just look how many "failures" were in post #3.... it had many chances to take off
I also believe that the key ultimately lies with the edge. If all of your years show a similar curve to that in your initial post, then you have a very high expectancy method. 900 trades is a very respectable sample, IMHO.

i actually look at it as an airplane trying to get off the ground... and when it soars, watch out buddy!
Ignored
Good luck, Tom, I hope it takes off like the Concorde

David
 
 
  • Post #26
  • Quote
  • Jul 6, 2008 9:04pm Jul 6, 2008 9:04pm
  •  BigFace
  • | Joined Feb 2006 | Status: Trading other Traders | 102 Posts
The Fixed Fraction approach can certainly boost the equity curve.....even a "semi-wimpy" 6% FF....
Attached Image (click to enlarge)
Click to Enlarge

Name: AudJpy 60 mins.JPG
Size: 139 KB
 
 
  • Post #27
  • Quote
  • Jul 6, 2008 9:06pm Jul 6, 2008 9:06pm
  •  tdion
  • Joined Nov 2005 | Status: EURUSD Quant FREAK | 3,197 Posts
yes, and although there aren't guarantees it will work, it is amazing when it does.

hey bigface, cut your PMs on, man.
 
 
  • Post #28
  • Quote
  • Last Post: Jul 24, 2016 3:14pm Jul 24, 2016 3:14pm
  •  GPips
  • Joined Sep 2010 | Status: Member | 397 Posts
A risk of ruin above 0% is a guarantee you will go bust, its just a matter of time!

Download a Free Risk to Ruin Calculator here ... http://bettersystemtrader.com/riskofruin/
Find The Pain Points On Your Chart & Trade Off Those Levels
 
 
  • Trading Discussion
  • /
  • Monte Carlo w/ your money management
  • Reply to Thread
    • 1 Page 2
    • 1 Page 2
0 traders viewing now
Top of Page
  • Facebook
  • Twitter
About FF
  • Mission
  • Products
  • User Guide
  • Media Kit
  • Blog
  • Contact
FF Products
  • Forums
  • Trades
  • Calendar
  • News
  • Market
  • Brokers
  • Trade Explorer
FF Website
  • Homepage
  • Search
  • Members
  • Report a Bug
Follow FF
  • Facebook
  • Twitter

FF Sister Sites:

  • Metals Mine
  • Energy EXCH
  • Crypto Craft

Forex Factory® is a brand of Fair Economy, Inc.

Terms of Service / ©2023