Joined Jan 2007
|
Status: Stochastic pipster
|1,657 Posts
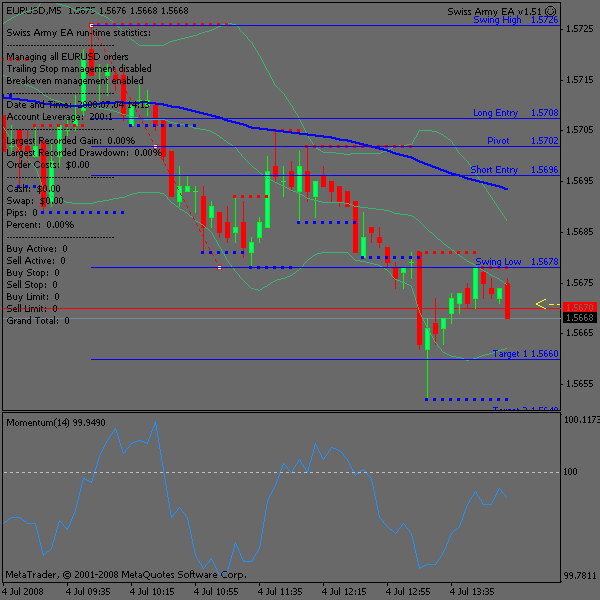
A successfull trade yesterday rounding 4 time my risk => 2% of my equity. Despite it's a T3 hit to the pip, it's again less than what it should be mathematically speaking because of the tighteness of the trade and the spread impact.
sidenote : I had a +1 pip short trade on the previous move down (i mentionned this potential trade on my previous post, my risk was also .5% of my equity)
Joined Jan 2007
|
Status: Stochastic pipster
|1,657 Posts
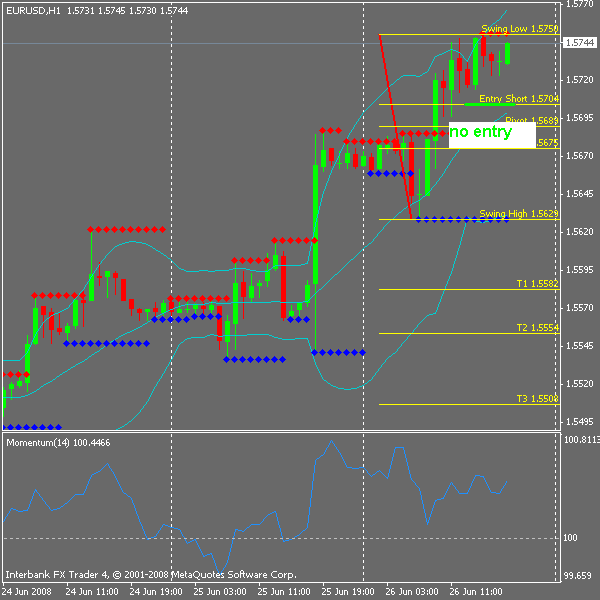
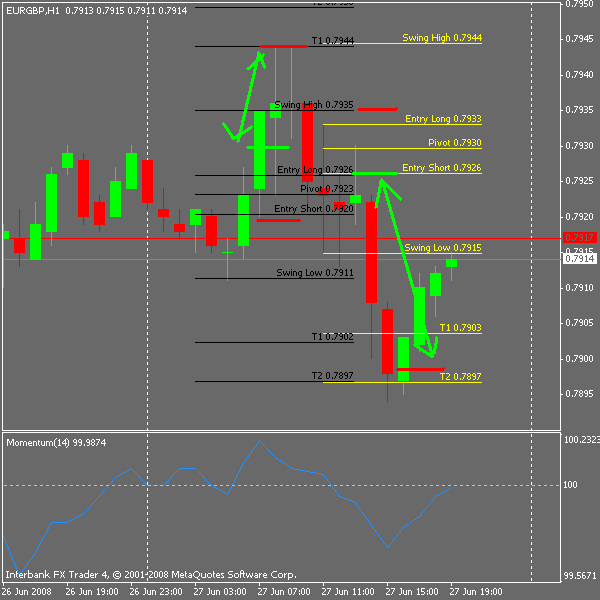
Here is two trades i took today. I should not have taken the 1st one looking afterward. Eventually if i had taken it @ .7928 and not .7930 the ratio would have been 2/1
Even if it was successfull, the risk ratio was near 1/1.
The second one was definitly better with a 3/1 ratio.
Joined Jan 2007
|
Status: Stochastic pipster
|1,657 Posts
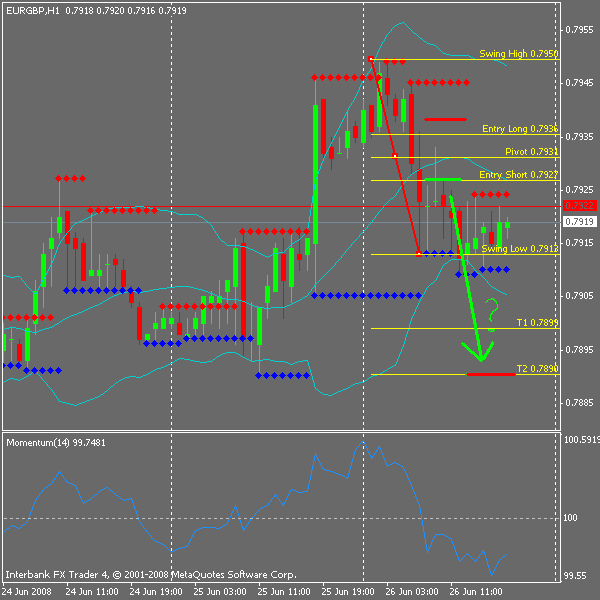
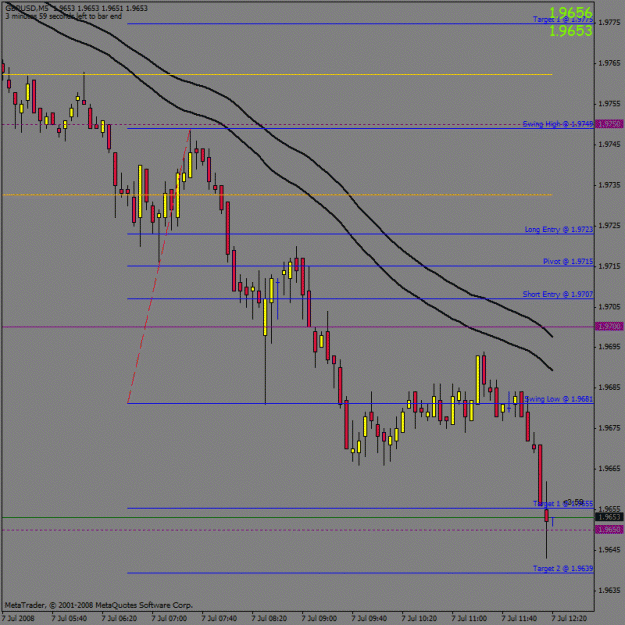
Only this trade ATM... Works on any time frame. Do not look at how manypips i have made, it is not relevant. My risk was 80 pips so i should have at least 160 pips to make a really profitable trade (always aim at least 2/1)
As i have no time to make a proper risk/balance calculation, i use only 0.1 lot demo trade and track the loosing and winning trade and make a calculation from here.
simple and good !
i have green results till now. thanks
except any indicators i just use GANN - to confirm a signal
as here i took short. thats nice system !
Thanks again for the input. I'll have a look into this and see if there is a very good increase in the stats but i like to keep my strategy simple
Can you post the indicator you use for R1 R2 pivot etc ?
Some great trades today
I entered the USDY a bit late and this saved me from the spike... If i had entered 100% to me rule i would have gotten kicked out.
Ignored
Ok, mate, here's the indicator. It's called the FXI Pivot, and what I like about it is that you can set it for any amount of weeks behind, and you can do some backtesting, knowing that the pivots you see are the ones relevant to that day! Pretty neat.
Things were pretty quiet first thing, but it livened up a bit from just before lunch-time onwards. I like the simplicity of this fib system of yours. It reminds me of boxingislife's sexy stochastics........no screens full of indicators left, right and centre, but a nice clear picture of the price and what it's doing. I tell you, mate, some of the charts I see on FF make my head hurt, and I often wonder how they make any sense of them!
Cheers
Ignored
Sexy stochastic is also very simple and i used it for quite a while (up until now in fact ^^ ) but with this strategy it's even more simple if one use pending orders.
Joined Sep 2006
|
Status: Son of this Sceptred Isle.
|3,635 Posts
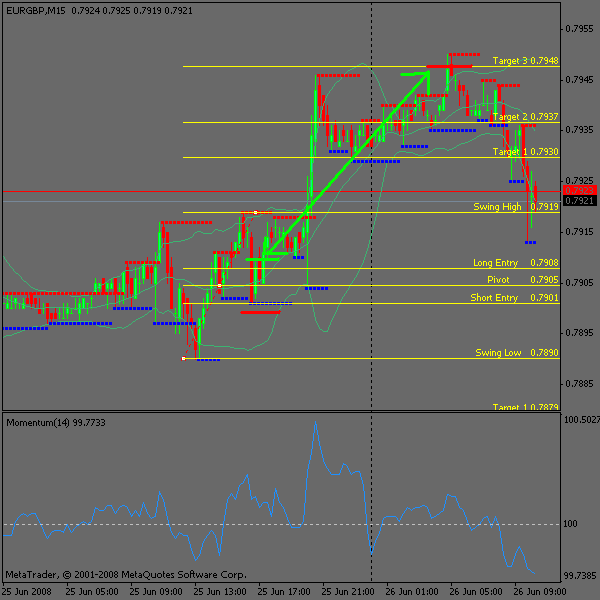
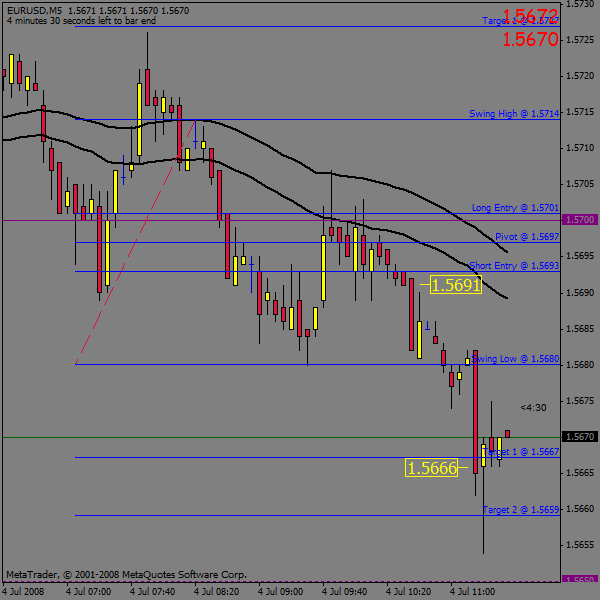
Off the 5min eur/usd chart. The two black lines are 60ema's High and Low, which, as you can see, coincided with the Long Entry and sweetspot, which price reversed off. Once price breached the Target 1 line, I was happy to close the trade, as I wasn't really confident it would go much further. If you look at the candle following my exit, the long bullish shadow seems to have justified my decision.
Off the 5min eur/usd chart. The two black lines are 60ema's High and Low, which, as you can see, coincided with the Long Entry and sweetspot, which price reversed off. Once price breached the Target 1 line, I was happy to close the trade, as I wasn't really confident it would go much further. If you look at the candle following my exit, the long bullish shadow seems to have justified my decision.
Ignored
Yes this pin bar was a good exit sign. But you did not took the right swing high (check the picture)
I'm not trading today not even in demo. First, it's friday and second US is closed.
Yes this pin bar was a good exit sign. But you did not took the right swing high (check the picture)
I'm not trading today not even in demo. First, it's friday and second US is closed.
Ignored
Yes, I see what you mean about the swing high. I've just adjusted it, and see how it could have been a better trade. Oh well, we live and learn!
Better luck next week, hopefully. Have a good weekend, mate.
Cheers
Joined Sep 2006
|
Status: Son of this Sceptred Isle.
|3,635 Posts
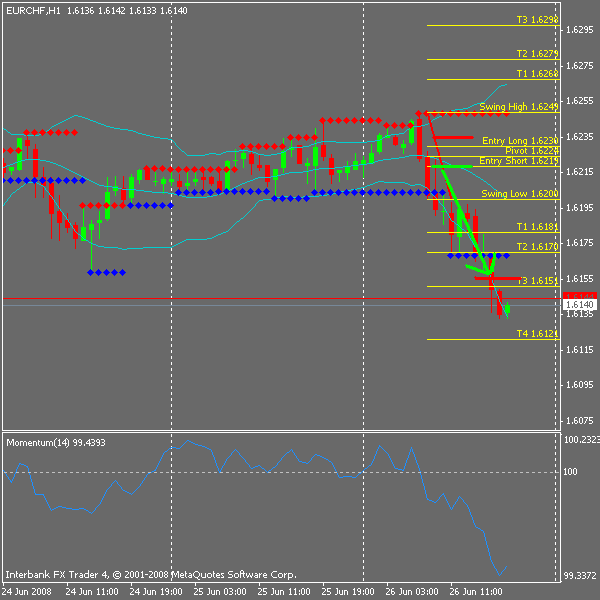
Nice cable trade this morning. I let this one run, as the double-60ema's were clearly showing a continuous downtrend. Price consolidated for a couple of hours, so I just kept an eye on it until it decided to drop down to Target 1. I exited the trade just below that, and price is doing a little more consolidating as I type this.
Nice cable trade this morning. I let this one run, as the double-60ema's were clearly showing a continuous downtrend. Price consolidated for a couple of hours, so I just kept an eye on it until it decided to drop down to Target 1. I exited the trade just below that, and price is doing a little more consolidating as I type this.
Ignored
Nice trade ! And it stick to the rules
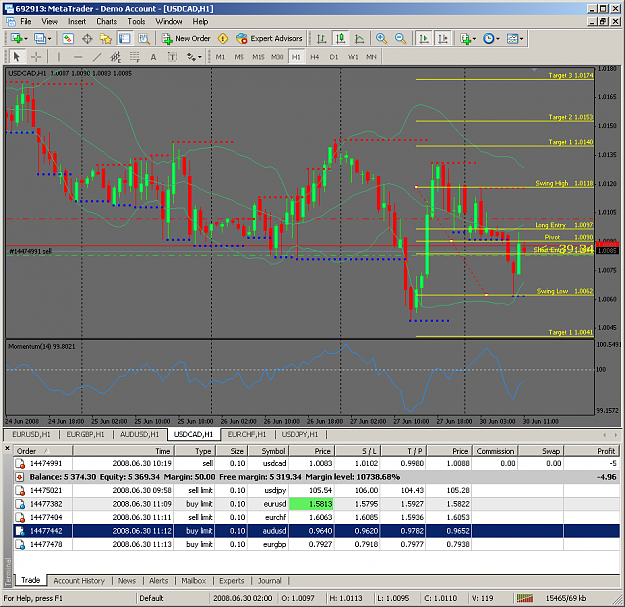
I have tried to use the pivot but if i agree it is great on lower TF, on longer TF it just encumbering the trade window so it's not for me.
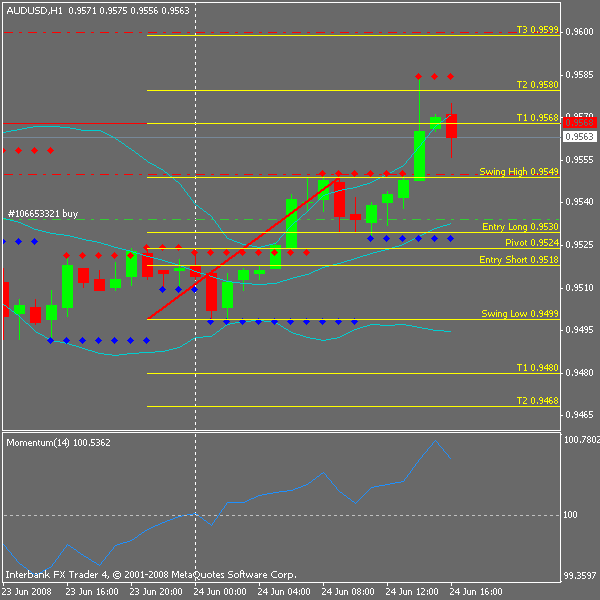
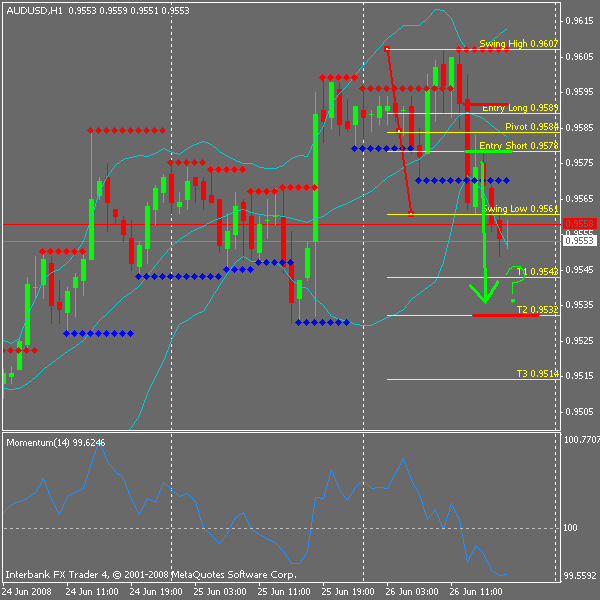
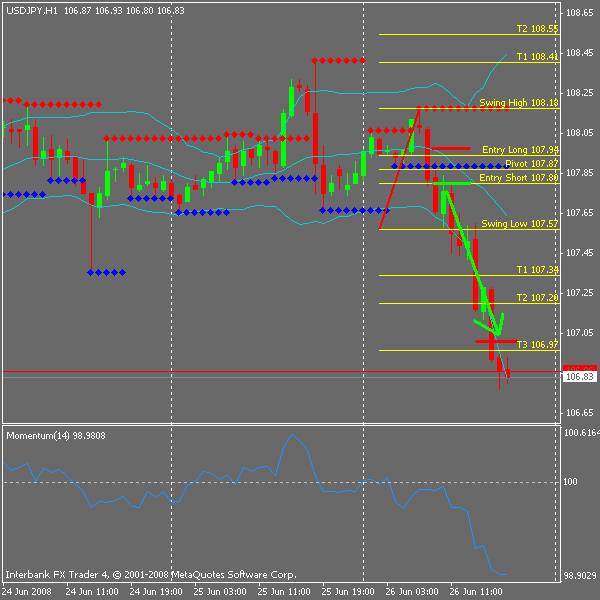
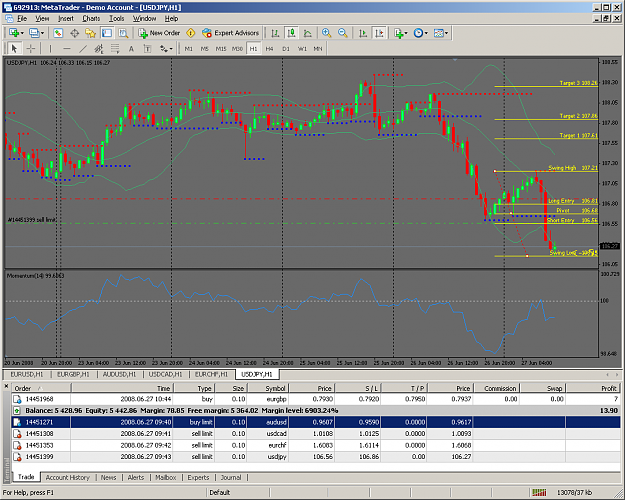
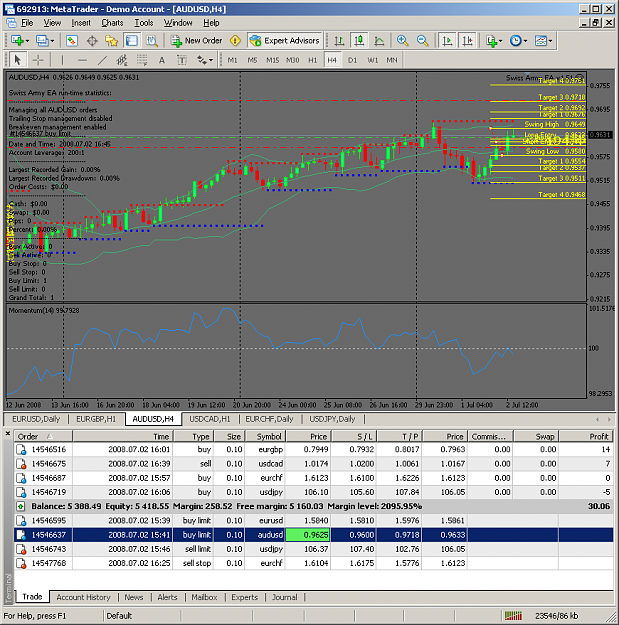
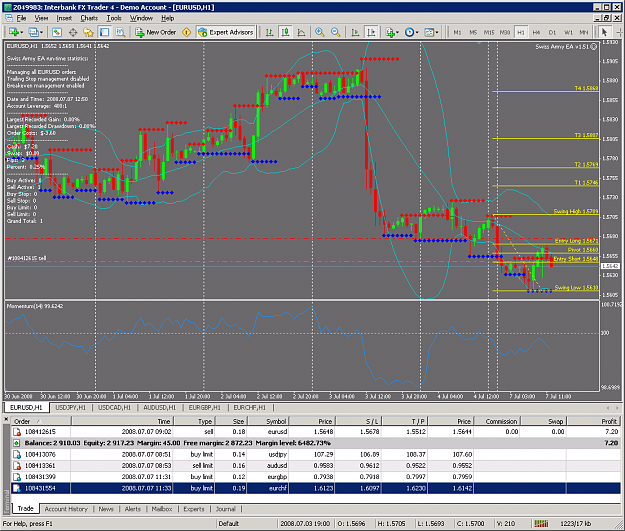
Today trades with proper risk/trade calculation (2% on this demo account)
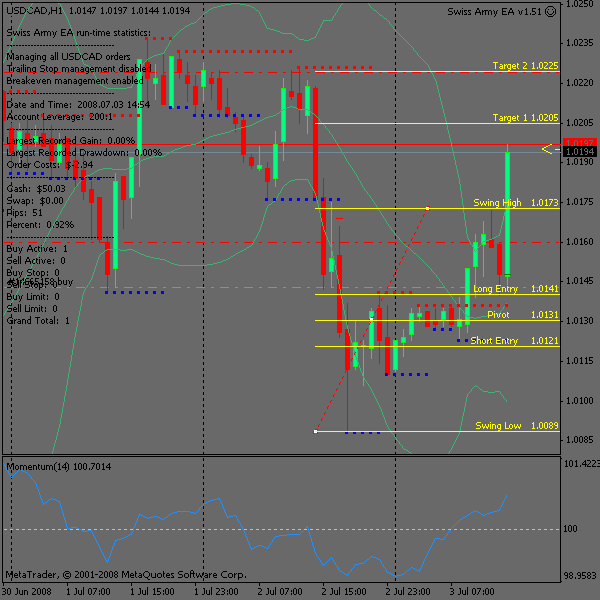
The AUDUSD trade has missed the entry point by 3 pips and i forgot the USD/CAD which would be on BE+5 right now