Joined May 2007
|
Status: I Love EMAS!
|1,968 Posts
For the newbies only:
If you are going to buy a pair, buy it close to daily, weekly, or monthly support, with sl on opposite side. Dont chase the market. Get a good price to own it.
all bearish with a bullish candle following them. tomorrow will be bullish on cable and thursday will be bearish (if we touch the upper tl in my previous post)
cable's been very easy and predictable. that patter has been going on since march. it's a slow BUMPY downtrend.
Would you be using an SL there Quecee? Wondering where you think would be a good SL for 211.4/6.
Ignored
No, because I still have positions at 212.75 or so, additional sell order would make my avg. position ar'd 212.35/40 area so my SL would be +50 pips to lock in profit which puts it ar'd the 211.85/95 area. . .
all bearish with a bullish candle following them. tomorrow will be bullish on cable and thursday will be bearish (if we touch the upper tl in my previous post)
cable's been very easy and predictable. that patter has been going on since march. it's a slow BUMPY downtrend.
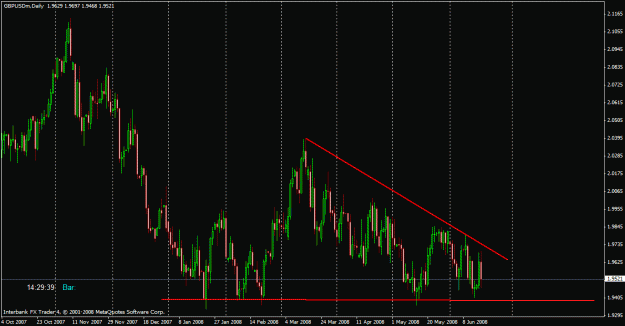
here's a daily chart showing the stupid descending triangle it's been playing for the past 3 months. breach of either TLs will surely tell the direction of the next coming "un-bumpy" trend.
211.45/65 looks like a good entry for a short to me
Ignored
Yep, again I think GU will be the catalyst to get it there while $ is sold off. . .
Look at GU and EU as $ continues to make its way south. . . I think we'll see UJ at Londons lows if not lower, I'm thinking 107.20/107 (if 108 is breached) will be tested soon which should eventually drag GJ with it. . . Ultimately I see GJ at 210.30's/209.40/60 area on a failure above. . .
Would you be using an SL there Quecee? Wondering where you think would be a good SL for 211.4/6.
Ignored
A good SL would be above the daily pivot. . . If price makes a daily close above the DP GJ will head up to test 213.40/50 area 1st target. A failure at the DP will drag price down to 209.40 area. . .
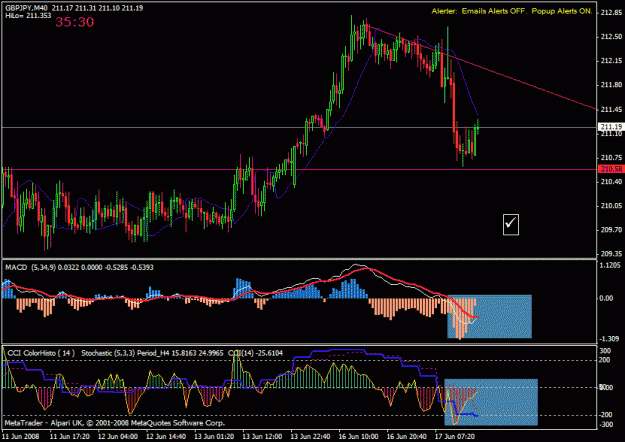
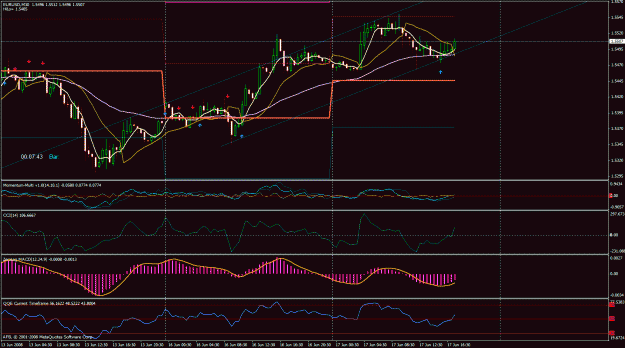
sorry for the delay, i was on my way to work.
this is a 40min chart... i marked the oscillators so that you can see they got out of that extreme OS level... but at the same time, h4 stochastic is extremely OS; also, price is below h4 gann, so short term bias is bearish.
this configuration makes me think we will most likely have another push down, let's say from 211.50 area (you can look on 5min chart for a good entry) and it will go lower than 210.63. right now i can think of 209.60 as a TP, but to tell you the truth it can be anywhere between 207.50 and 209.60. it can even go lower to test the daily gann or the daily trend line (which on my chart are on the same area).
we'll see.
EU's upside looks limited short-term. . . I see a pullback coming soon down to 1.5400 area before heading back up to test 1.56/1.57/1.58 area. . .
Take a look at your 1hr chart - I see 5 waves up from 1.5300 area. . . It looks like it is in a 3 wave correction down that will end at ar'd 1.54 area.
I'm looking to go long ar'd that area. . . of course this is JMHO!
sorry for the delay, i was on my way to work.
this is a 40min chart... i marked the oscillators so that you can see they got out of that extreme OS level... but at the same time, h4 stochastic is extremely OS; also, price is below h4 gann, so short term bias is bearish.
this configuration makes me think we will most likely have another push down, let's say from 211.50 area (you can look on 5min chart for a good entry) and it will go lower than 210.63. right now i can think of 209.60 as a TP, but to tell you the truth it can be anywhere between 207.50 and 209.60. it can even go lower to test the daily gann or the daily trend line (which on my chart are on the same area).
we'll see.
Ignored
thanks big guy
confirms the aus 4h strategy, retrace to 5sma, after that i'll post crappy doo
sorry for the delay, i was on my way to work.
this is a 40min chart... i marked the oscillators so that you can see they got out of that extreme OS level... but at the same time, h4 stochastic is extremely OS; also, price is below h4 gann, so short term bias is bearish.
this configuration makes me think we will most likely have another push down, let's say from 211.50 area (you can look on 5min chart for a good entry) and it will go lower than 210.63. right now i can think of 209.60 as a TP, but to tell you the truth it can be anywhere between 207.50 and 209.60. it can even go lower to test the daily gann or the daily trend line (which on my chart are on the same area).
we'll see.
EU's upside looks limited short-term. . . I see a pullback coming soon down to 1.5400 area before heading back up to test 1.56/1.57/1.58 area. . .
Take a look at your 1hr chart - I see 5 waves up from 1.5300 area. . . It looks like it is in a 3 wave correction down that will end at ar'd 1.54 area.
I'm looking to go long ar'd that area. . . of course this is JMHO!
Ignored
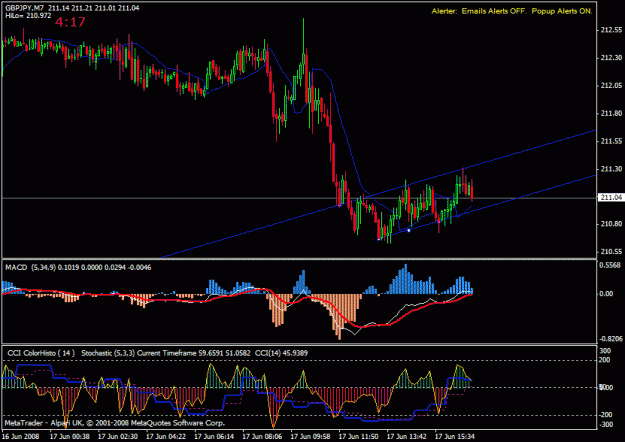
thanks big guy, i didn't get any confirmation yet. that IS a bearish flag we're in right now. and a breach lower would mean showtime
i thought another chart would be useful, so let's go to a lower timeframe (7min ) to "dissect" this retracement. as you can see, it's almost done: it's getting weaker (40min stochastic is trying to become OB, histo macd shows a bearish divergence) and all we have to do is wait for a confirmation to open a short: break of the channel + macd cross.
that's pretty much it for now.
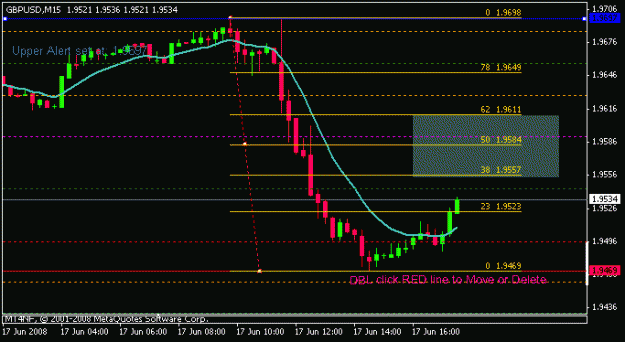
Cable had trouble getting much past its 23.6% retrace and stalled at its June 6th low of 9536 - if this is all the retrace that it can make, then its weaker than I thought - good for the GJ short that I've just taken......