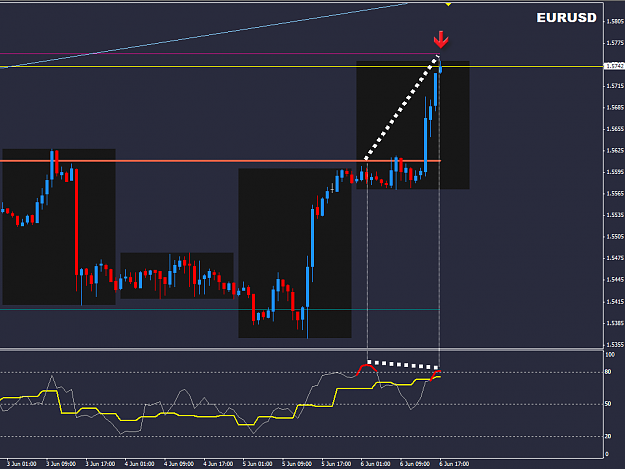
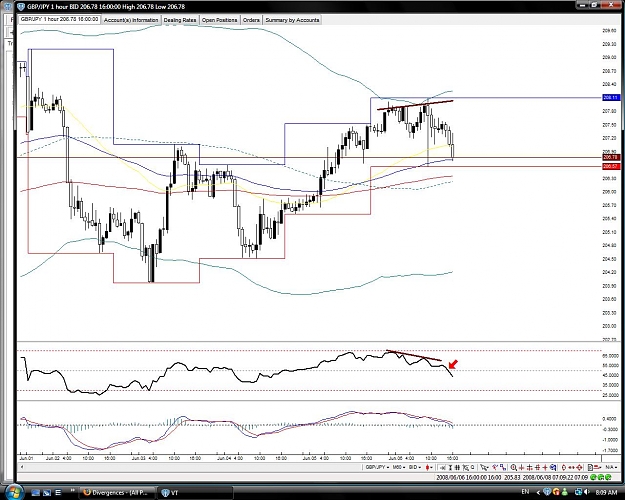
thank you for quick reply so I can enter now or I miss the trade?and here more is this hidden bearish divergence?
Ignored
Personally I'd prefer the hidden divergence as the highs are more pronounced with more air space versus the regular divergence where not so much airspace in between the lows. Just the way I look at the chart really. Anyways if you want to play the hidden divergence game check out your daily chart...you should see it there too.
I see hidden bullish divergence on cable Daily..anyone get it(using stoch 5,3,3)and this also what I see on weekly cable chart;
bullish Divergence can anyone comments.
p/s:I only post weekly chart but hope people also comment what I see in daily chart.
Will be interesting to monitor the EU, it showed bullish divergence on the 1 hr chart (confirmed by the break of 1.5550) yet on the 4 hour it also shows hidden divergence - if it stays below the last lower high of 1.5627.
Will be interesting to monitor the EU, it showed bullish divergence on the 1 hr chart (confirmed by the break of 1.5550) yet on the 4 hour it also shows hidden divergence - if it stays below the last lower high of 1.5627.
[quote=B@by trader;2040607]I see hidden bullish divergence on cable Daily..anyone get it(using stoch 5,3,3)and this also what I see on weekly cable chart;
bullish Divergence can anyone comments.
p/s:I only post weekly chart but hope people also comment what I see in daily chart.[/quote\]
I see hidden bullish divergence on cable Daily..anyone get it(using stoch 5,3,3)and this also what I see on weekly cable chart;
bullish Divergence can anyone comments.
p/s:I only post weekly chart but hope people also comment what I see in daily chart.[/quote\]
can someone answer me?
Ignored
yes your quite right there's hidden bullish div on cable daily! nfp could decide if it plays out so watch this space
how about my weekly pic can you comment it
p/s:cable up after news
Ignored
yeah your correct, bullish div on cable weekly although i like to see the divergence lines both showing an angle rather than either being level (as in the price lvl on cable weekly lows) but thats just me.... it's still a valid signal.
I dont think this is wrong - instead a Class C - which is weak - but gives the head up before the Class A - see below :
Class A negative bearish divergence-prices reach a new peak while an indicator reaches a lower peak. This is the strongest sell signal. Class A positive bullish divergence-prices fall to a new low while an indicator stops at a more shallow low than before. This is the strongest buy signal. Class B negative bearish divergence-prices trace a double top while an indicator reaches a lower peak. This is the second strongest sell signal. Class B positive bullish divergence-prices trace a double bottom while an indicator traces a higher second bottom. This is the second strongest buy signal. Class C negative bearish divergence-prices reach a new peak while an indicator traces a double top. This is the weakest bearish divergence. Class C positive bullish divergence-prices fall to a new low while an indicator makes a double bottom. This is the weakest bullish divergence.
Ignored
ok thank you for tht but your details is about regular divergence.right?
can give details for hidden one?
p/s:sorry if I misunderstand im still new in this technique.
let me tell you a secret... the class doesn't really matter, all you need is to see the confirmation: trendline break + oscillator break through 0/50 (whichever is the mid point) . but don't tell anyone.
I dont think this is wrong - instead a Class C - which is weak - but gives the head up before the Class A - see below :
Class A negative bearish divergence-prices reach a new peak while an indicator reaches a lower peak. This is the strongest sell signal. Class A positive bullish divergence-prices fall to a new low while an indicator stops at a more shallow low than before. This is the strongest buy signal. Class B negative bearish divergence-prices trace a double top while an indicator reaches a lower peak. This is the second strongest sell signal. Class B positive bullish divergence-prices trace a double bottom while an indicator traces a higher second bottom. This is the second strongest buy signal. Class C negative bearish divergence-prices reach a new peak while an indicator traces a double top. This is the weakest bearish divergence. Class C positive bullish divergence-prices fall to a new low while an indicator makes a double bottom. This is the weakest bullish divergence.
let me tell you a secret... the class doesn't really matter, all you need is to see the confirmation: trendline break + oscillator break through 0/50 (whichever is the mid point) . but don't tell anyone.
Ignored
TQ scrat for the secret.
I know tht we must have tl break comfirmation but what is oscillator break through 0/50?
I will be glad if you give picture of example