• Home
  • Forums
  • Trades
  • News
  • Calendar
  • Market
  • Brokers
  • Login
  • Join
  • User/Email: Password:
  • 12:06am
Menu
  • Forums
  • Trades
  • News
  • Calendar
  • Market
  • Brokers
  • Login
  • Join
  • 12:06am
Sister Sites
  • Metals Mine
  • Energy EXCH
  • Crypto Craft

Options

Bookmark Thread

First Page First Unread Last Page Last Post

Print Thread

Similar Threads

Trading with range bars ichimoku cloud & awesome oscillator 4,314 replies

Question on Awesome Oscillator 4 replies

Platforms w/ 'Chaos Awesome Oscillator'? 7 replies

Awesome Oscillator 1 reply

Trade Awesome Oscillator Divergences! 7 replies

  • Trading Systems
  • /
  • Reply to Thread
  • Subscribe
  • 11
Attachments: Trading System using Awesome Oscillator
Exit Attachments
Tags: Trading System using Awesome Oscillator
Cancel

Trading System using Awesome Oscillator

  • Last Post
  •  
  • Page 1 2 3
  • Page 1 2 3
  •  
  • Post #1
  • Quote
  • First Post: Jan 30, 2007 9:23am Jan 30, 2007 9:23am
  •  gblair
  • | Joined Oct 2006 | Status: Member | 11 Posts
I have been been using a simple trading system using the Awesome Oscillator and Accelerator/Decelerator Oscillator for four weeks now and was hoping I could get some help and ideas on making it better and setting SL and TP's.

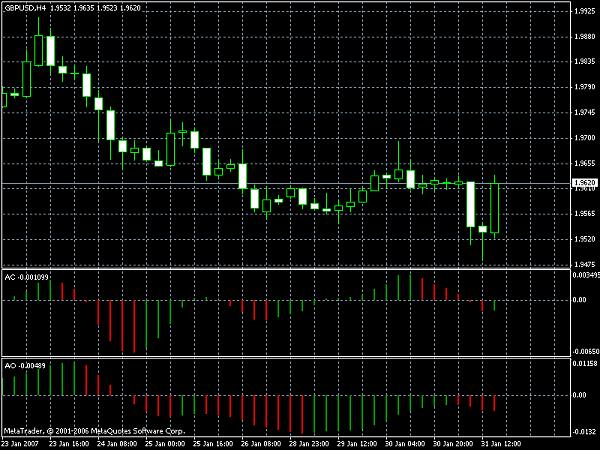
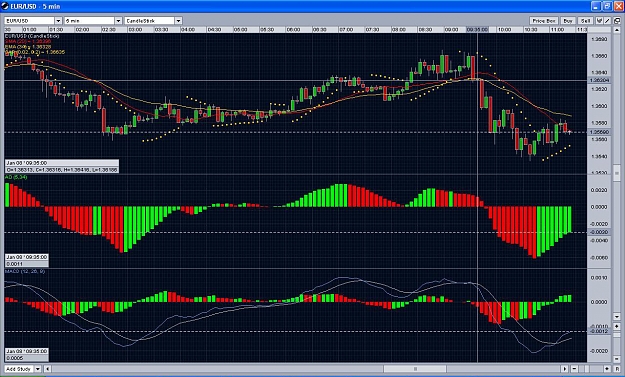
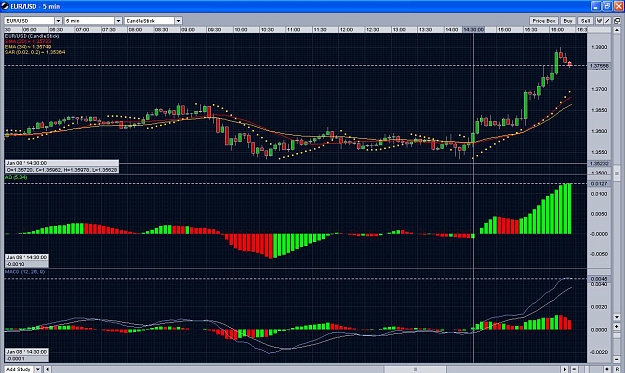
I use the Awesome Oscillator (AO) and the Accelerator/Decelerator Oscillator (AC) indicators on a 4hr, MetaTrader chart with GBP/USD.

I enter a trade on the close of a 4 hr candle when I have change of color on the AO and two consectutive and same colors on the AC. I exit trade on the close of a 4 hr candle when I have the same opposite colors on both AO and AC. (ie if the AO changes from red to green with the AC being green and having a previous AC 4 hr green, I buy. I close when the AO and AC are both red at the same time on a 4 hr close).

I enter with two equal lots, both set at SL of -70 pips. At +50 pips I move one lot to break even. At +100 pips I move the first lot to 50 pip trailing and move the second lot to BE. at +150 pips I move the second lot to 100 pip trailing.

Since I use Oanda, I have to manually move the SL for trailing stops, which mean I miss the exact point sometimes.

System total for week of Jan 7-12 was +564 pips, Jan 14-19 was -191 pips, Jan 21-26 was +70 pips. This was the total pips for two lots. For this week I entered two lots Monday morning at 1.9574. The first lot was stopped out at +70 pips and the second lot is currently +54 pips with the SL at BE.

The first three weeks I did not get anywhere close to the system totals as I kept second guessing the system.

Any insight on the system, stop losses, take profits, ect. would be appreciated.
  • Post #2
  • Quote
  • Jan 31, 2007 8:11am Jan 31, 2007 8:11am
  •  gblair
  • | Joined Oct 2006 | Status: Member | 11 Posts
The AO changed back to red on the close of the candle at 2 am EST. The AC had been red since the close of the Tuesday 10 am EST candle. This closed the second lot for +47 pips.

The system also gave signal to sell two lots at 1.9622 at 2 am EST. Around 4:30 am EST it bottomed out at 9511 then rose to 9556 around 5:45 am. At +100 pips a 50 pip trailing stop was initiated on the first lot which would have have stopped out the first lot at +61 pips. The second lot is at BE and currently is at +95 pips.

I woke at 2 am to check to the close of the candle and closed the second lot on earlier trade, however I second guessed the system again and did not enter the sell trade .
 
 
  • Post #3
  • Quote
  • Jan 31, 2007 10:23am Jan 31, 2007 10:23am
  •  deathpan
  • | Joined Dec 2006 | Status: Member | 8 Posts
heyy. can you put here your template and screen shots pls. and did you do any backtest on it?
 
 
  • Post #4
  • Quote
  • Jan 31, 2007 1:40pm Jan 31, 2007 1:40pm
  •  gblair
  • | Joined Oct 2006 | Status: Member | 11 Posts
Deathpan, I'll try to add a screen attachment.

I started manually back testing from last January and got up to June, but I've since changed some the rules and have not had a chance to go back and apply them or finish out the year. I started out looking for raw gains and losses, then added a SL of -70. The TP I based on change of color at the close. These numbers are one lot only, whereas I am now trading with two lots.

Jan 06 +594
Feb 06 +114
Mar 06 +446
Apr 06 +460
May 06 +185
June 06 +607

Half yr total of 2406
Attached Image
 
 
  • Post #5
  • Quote
  • Jan 31, 2007 1:52pm Jan 31, 2007 1:52pm
  •  aegis
  • | Joined Oct 2006 | Status: Member | 80 Posts
Quoting gblair
Disliked
Deathpan, I'll try to add a screen attachment.

I started manually back testing from last January and got up to June, but I've since changed some the rules and have not had a chance to go back and apply them or finish out the year. I started out looking for raw gains and losses, then added a SL of -70. The TP I based on change of color at the close. These numbers are one lot only, whereas I am now trading with two lots.

Jan 06 +594
Feb 06 +114
Mar 06 +446
Apr 06 +460
May 06 +185
June 06 +607

Half yr total of 2406
Ignored
Have you been looking at the 30 min chart when doing your manual backtests, because if you're just looking at the 4 HR chart you are going to get a very inaccurate backtest. There's a lot of price action within those bars.
 
 
  • Post #6
  • Quote
  • Jan 31, 2007 1:56pm Jan 31, 2007 1:56pm
  •  gblair
  • | Joined Oct 2006 | Status: Member | 11 Posts
The second lot was closed out at break even when the GBPUSD climbed above 9622 after 11 am EST.

So far this week in two trades the system is +178 for two lots (with a spread of 12 pips on four trades it is +166).


Trade 1
Lot 1 +70
Lot 2 +47

Trade 2
Lot 1 +61
Lot 2 +0
 
 
  • Post #7
  • Quote
  • Jan 31, 2007 2:34pm Jan 31, 2007 2:34pm
  •  Walid Elhelw
  • | Joined Aug 2006 | Status: Trader inside! | 28 Posts
can u post an photo example Please

~Walid
 
 
  • Post #8
  • Quote
  • Jan 31, 2007 3:36pm Jan 31, 2007 3:36pm
  •  Taters
  • | Joined May 2006 | Status: Member | 185 Posts
Quoting gblair
Disliked
...Any insight on the system, stop losses, take profits, etc. would be appreciated.
Ignored
Interesting timing on the post, as I was about to put a call out to see if anyone was using the "Profitunity" system as it is known.
First, apologies if you know all this already, but maybe it will open up the conversation,and since you asked...
There is actually a codified system for using the so-called Awesome Oscillator and Accelerator. If you haven't already, I would suggest reading Bill Williams' "Trading Chaos" and "New Trading Dimensions" a few times. There is more to it than just the AO & Acc- a whole system of directional signals, fractal buy/ sell orders, moving averages (Alligator), trailing stops, and money management, all there in black and white. Your technique is called "Trading in the Zones"- just a small part of the system. One of the first methods in the system involves filtering out choppy market signals and making sure you are in a "trend".This is one problem I see with the system- many of his examples are of the futures and commodities markets where the prices are going only in one direction for MONTHS at a time- the AO doesnt even cross to the upside at all. In my tentative forays into actually using the system I have found nothing better for sucking the pips from big trends, but if you don't follow the system exactly it will hand you your ass on a plate just as fast, and if you try to trade it in a choppy market you can kiss your account goodbye. Also, in some ways I don't believe this system lends itself to a 24 hour market cuz a lot can happen while you are sleeping that you would need to micro-manage. As far as stop losses go, he doesn't get into them much because of course his system barely needs them but in general a stop below the nearest Fractal is what I recall. Okay enough of my 2 pips worth- it's time for the wit and wisdom of Bill himself. Here's a money quote about stops from the "Tying it all Together" section of "New Trading Dimensions":

Step 4- Placing our first protection against loss:

"My choice generally at this point is to place a stop to get out of the market (go flat) on the first close of above(/below) the Alligator's teeth (Red Line). If the mouth does not open immediately and the Red line stop is closer than I want, I will place a stop and reverse at the first fractal in the opposite direction that is outside the teeth.

(ok the coffee is wearing off- I will now quickly paraphrase how profit is taken...)

1. a close below /above Alligator's teeth
2. Five consecutive bars of the same color moving stop below each bar
3. Green Line (Lips) stop
4. a "reversal" signal ( divergent candle...)

phew... There is MUCH MORE that bears discussion here but now Taters is tired.
GOOD LUCK to you sir!
 
 
  • Post #9
  • Quote
  • Jan 31, 2007 6:11pm Jan 31, 2007 6:11pm
  •  Taters
  • | Joined May 2006 | Status: Member | 185 Posts
Well gblair you put a bee in my bonnet. I made a pic of the same timeframe with many (not all!) of the signals of the Bill Williams system.
Net result? Normalized @ 1 lotip, approximately 897 pips not including slippage,spread, etc etc etc.
Part of the genius (and scary danger) of this is the money management aspect.
BW recommends a pyramid of entries:
First entry= 1 lot. If this goes your way and your signal is right, then...
Second entry= 5 lots,
Third entry= 4 lots
Fourth entry= 3 lots
Fifth entry = 2 lots
Sixth entry = 1 lot.

So laid out at the equivalent of 1 lot/ pip you get many more $ per pip than the 184 pip move would suggest. It would stink to have 5 lots go against your first entry though :surprised:flushed: !

I don't think BW trades "at market". Orders are placed 1 "tick" (the equivalent in Forex is a pip but this is too small I think...) below the signal. This way, the market has to be continuing in your direction for a signal to be taken, whereas if you just bought or sold at market price on the next candle- who knows? It might go against you and you'd be losin mad $.

PS: stop loss for first entry would be above the high of the highest candle.
Red horizontal lines show approximate entry bars. If you were more conservative these would be farther from the bottom of the candles; less signals, less draw down, less profit.

Just for the record this post is for informational purposes only. I'm not an expert using this system. I just read a book is all. I don't necessarily advocate using these techniques, and your mileage may vary.
Attached Image
 
 
  • Post #10
  • Quote
  • Feb 5, 2007 12:35pm Feb 5, 2007 12:35pm
  •  Taters
  • | Joined May 2006 | Status: Member | 185 Posts
I found a page on the Alpari web site that has a roundup of so-called "Chaos Theory" trades, including Zone trades that were the point of this thread.
Puts things more simply than I probably did!
Cheers,
Taters

Zones...

Overview...
 
 
  • Post #11
  • Quote
  • Feb 6, 2007 9:33am Feb 6, 2007 9:33am
  •  dlftrader
  • | Joined May 2006 | Status: Member | 36 Posts
gblair:

You are using a couple of Profitunity indicators. These indicators and Profitunity methodologies play a significant role in my trading as well.

Relative to placement of a protective stop, I strongly urge you to consider using market driven stop placements as oppossed to dollar ones; markets are not linear. For example: Since you are trading off of the H4 chart; use the next higher significant time frame chart (D1 in your case) and use its 1st or 2nd S/R levels when placing initial protective stops--below if long, above if short. Using market driven protectve stops on the next significant time frame larger than the one you are trading off of is particularly important if you find yourself getting stopped out too often in trades that otherwise would have been winners.

There is an old trader axiom: "Winning traders do not exit with the trend, they exit against it." If you want or need to use a profit target (limit order), I suggest you set it where reward would equal the initial risk + the spread (and maybe a pip or two for slippage. Covering your risk and trade cost is a good trade; my feeling is that too many traders turn their winners into loserers by shooting for a popular risk-reward ratio (1:1.5, 1:2; or heaven forbid, even greater ratios!).

My experience is that you will make money following the indicators and trade rules you specified; but I believe you can be more profitable by adding two more of the Profitunity indicators to your charts--Fractals and the Alligator--and learning how to use them; and using your AO and AC setup as filters rather than triggers in a trade. The developer of the Profitunity indicators and methodologies is Bill Williams, PhD. He authored two books (Trading Chaos in 1995 and New Trading Dimensions in 1998) and co-authored another (Trading Chaos Second Edition in 2004) with his daughter who is now the day-to-day head of his Profitunity Trading Group. If you want to get the most out of Bill's innovative approach to trading, read them all (in sequence).

...\larry.bye
 
 
  • Post #12
  • Quote
  • Feb 6, 2007 11:39am Feb 6, 2007 11:39am
  •  gblair
  • | Joined Oct 2006 | Status: Member | 11 Posts
Tater and Dlftrader, thanks for the responses and advice.

I've decided to shelve my trading stradegy using the AO and AC unitl I've had a chance to read up on the William's books you guys suggested.

I like the indicators and think I can someday get them to work for me.

Thanks again.
 
 
  • Post #13
  • Quote
  • Feb 6, 2007 12:14pm Feb 6, 2007 12:14pm
  •  et_phonehome_2
  • | Joined May 2006 | Status: Member | 809 Posts
I know that the higher TF is supposingly safer [less whipsaws], but would you actually wait for the color change on the 4H TF since its 4+ hrs you must wait before deciding to get out?
 
 
  • Post #14
  • Quote
  • Jun 22, 2008 7:02am Jun 22, 2008 7:02am
  •  sonicdeejay
  • | Commercial Member | Joined Mar 2008 | 9,229 Posts
Any news for t system??

sonic
 
 
  • Post #15
  • Quote
  • Jun 22, 2008 9:11am Jun 22, 2008 9:11am
  •  Petronix
  • | Joined Jun 2008 | Status: Measure 7 times, cut once | 20 Posts
I've been trading the system in the gold market, i use alligator, fractals, zigzag, AO, AC and Gator. average moves i get with his pyramid system, give on average 1000+ pips a day. losses usually incurred on 1st contract only. you have to sit there and monitor it. this is an active trading strategy, but the results are phenomenal when you really know what you're doing.

To improve your chances of success i also use 2 more windows, with over 10 indicators: MA's, rsi over ma crosses, stochs, macd, agx, bollinger, pSAR, alligator. USED Together they give accurate trade signals. when you're in trend, give it all you've got. i would be happy to risk around 10% of the account on the combined margins of Pyramid contracts. on the 19th i've downed around 1000 combined pips on gold, with a combined of 1.5 lots. Happens quite often nowadays with gold. a 200 pip move one way is achievable around every other day. gotta be in to win it.

Little discouragement though - dont think you'll make a killing. you have to study the system very carefully, practice until you are comfortable, then play small with micro lots until you feel safe. One day i will move to 1 lot, 5 lots, 4, 3, 2, 1 - thats a goal of mine. once i have couple of mills stashed away.
 
 
  • Post #16
  • Quote
  • Jan 7, 2009 12:48pm Jan 7, 2009 12:48pm
  •  hel13rock
  • | Joined Jan 2009 | Status: Aur Cymru | 381 Posts
Firstly I have to admit that I am a relatively new forex trader but I have been working hard on a personalised system for my own use to take profits from the trends on the 5 min charts. I chose this time frame and method because it requires a relatively small stop loss and once everything is closed your day is over and you can relax.

Secondly let me set out my understanding of trading on this time frame. In my view your best chance of turning a profit from these markets is to use a system that will give you clear entry signals at the start of a POSSIBLE trend, cut your losses short if you are wrong and ride your winners if you are right.

Ok, this is all fairly basic so far. This discussion sparked my interest because I use the AO and AC as the basis for my trading too.

I would greatly appreciate any constructive advice about the following system. It is a work in progress but I have been using and developing it on an ongoing basis and so far it is profitable. I am only trading a very small account but have increased it by 50% in the last month while risking 5-10% of my account per trade. I realise this is a large amount to risk per trade but obviously as my bank builds I am keeping my trades the same size so my risk per trade is getting smaller.

Ok, here it is...

Pre trade I check the higher time frames for any major support/resistance/trendlines.

The setup...

21, 55 and 89 EMAs applied to the close.
Parabolic SARs 0.01/0.1 and 0.05/0.5
Awesome and Accelerator oscillators
Momentum oscillator
CCI

* I know the last 2 do very similar things but I find one better for entries and the other better for exits.

The entry...

There are some points to bear in mind when searching for an entry...

If the slow SAR is trending very, very slightly and the faster SAR started trending significantly before the slower one (ie more than about 4 dots) then this is a sign of weakness in the signal (though not always).
Take into account the direction of the higher MAs, it is always better to trade in the direction of the existing trend but you should be able to preempt the start of a change in trend by the angle the MAs are diverging (this is down to practice and trial and error unfortunately and I doubt anyone will always be right with trying to spot a change of direction!).
Also, it is possible for a strong up or down candle to give you an initial signal only for the confirmation candle to go the other way even though all the other indicators are screaming at you to buy/sell. Avoid.

The main rules for the entry are as follows...

When the price closes above/below the 21 EMA, the AO and AC are the same colour and trending in the same direction (at least 2 bars agree), both parabolic SARs are above/below the price indicating the same direction, the momentum oscillator is above/below the 100 level (ie in the direction of the trend) then enter a trade with 2 lots (or portions of lots that you can sell half of). You can also use the CCI move above/below the 100/-100 level as a confirmation indicator. As I said earlier it does a very similar job to the momentum oscillator but they do vary slightly and the MO is better for entries whereas the CCI is better for exits.

In trade management/Exits...

I have revised this part of the system more than any other. At the moment this is my best exit strategy that I can come up with but maybe you can suggest better?

Place the stop loss 2 pips above/below the high/low of the candle prior to the signal candle or 20 pips from the entry price, whichever is furthest. Your first profit target is +20 pips. As soon as the trade opens trail the stop loss along the middle of the fastest SAR (colour them differently) until you reach breakeven then trail the stop loss by the slower SAR or until the CCI moves above/below the 0 level against the trend (make sure it does cross as it can bounce back easily).

This is the basic system I have been using and it works just fine but if anyone can help me improve it I would really appreciate it. Thanks for reading this far.

I have attached a gif image of a trade screen on the GBPUSD.

A is the buy candle. You couldn't have opened the trade on the previous candle as the parabolic SARs were against the previous candle. As they changed the setup became valid for a buy signal on the candle marked, note at the open of this candle, not at the top.

B is all the other indicators agreeing. Don't forget they will have changed due to the movement of the price for that bar but they were still in agreement before that upwards move.

C is trailing the stop after the initial 20 pip profit has been taken. This move was happening a little slowly but was going up.

The second image is after the close of the trade. A is the parabolic SARs against the trade and B is the CCI crossing the 0 level.

This was a good trade which made me 66 pips on both lots combined but rest assured there will be many times that you are stopped out but I think using the 2 different SARs will prevent you from both losing too much at the start of your trade and from exiting too early at the end of your trade.

If you can see anything obvious in the way of an improvement then please let me know.
Attached Image(s) (click to enlarge)
Click to Enlarge

Name: trade1.GIF
Size: 48 KB
Click to Enlarge

Name: trade2.GIF
Size: 44 KB
 
 
  • Post #17
  • Quote
  • Jan 7, 2009 6:48pm Jan 7, 2009 6:48pm
  •  sonicdeejay
  • | Commercial Member | Joined Mar 2008 | 9,229 Posts
I like AC and AO stuff...
Update more often...

thx
Sonic
 
 
  • Post #18
  • Quote
  • Jan 8, 2009 4:27am Jan 8, 2009 4:27am
  •  arubin
  • | Joined Dec 2008 | Status: Member | 43 Posts
I really like using the AO and I got some ideas about the trade from a system called "pip nailer" but I modified it a little bit for myself.
I go into a trade when there is a cross on a MACD followed by a PSAR indicator and the important thing about PSAR is that it must be in agreement with AO, like on this trade that I attached the picture of.
For a SL I use the previous swing high, but still trying to figure out the profit target, I took that trade and made 40 pips on it, but could have made more.
Attached Image (click to enlarge)
Click to Enlarge

Name: eurusd 5 min.JPG
Size: 303 KB
 
 
  • Post #19
  • Quote
  • Jan 8, 2009 9:27am Jan 8, 2009 9:27am
  •  arubin
  • | Joined Dec 2008 | Status: Member | 43 Posts
here is an example of another trade today. entry at 14.30 (GMT +2)
Attached Image (click to enlarge)
Click to Enlarge

Name: 5 min eur usd.JPG
Size: 281 KB
 
 
  • Post #20
  • Quote
  • Jan 13, 2009 1:50am Jan 13, 2009 1:50am
  •  Petronix
  • | Joined Jun 2008 | Status: Measure 7 times, cut once | 20 Posts
Mate, your best bet is to use original AO and AC entry and exit rules. I dont want to infringe Williams copyrights, so i just suggest you read his 3 books. espeacially good for beginner. Personally, my best trades come only by using MFI, volume and alligator. Forget about 40-50 pips, mate. A Squat breakout can give you hundreds of pips per day in a volatile market, such as gold. Low risk, high return. Dont complicate things - easier the system , the better.
I learned that hundreds of indicators only confuse you in the end. So now i just sick by 3.
 
 
  • Trading Systems
  • /
  • Trading System using Awesome Oscillator
  • Reply to Thread
    • Page 1 2 3
    • Page 1 2 3
0 traders viewing now
  • More
Top of Page
  • Facebook
  • Twitter
About FF
  • Mission
  • Products
  • User Guide
  • Media Kit
  • Blog
  • Contact
FF Products
  • Forums
  • Trades
  • Calendar
  • News
  • Market
  • Brokers
  • Trade Explorer
FF Website
  • Homepage
  • Search
  • Members
  • Report a Bug
Follow FF
  • Facebook
  • Twitter

FF Sister Sites:

  • Metals Mine
  • Energy EXCH
  • Crypto Craft

Forex Factory® is a brand of Fair Economy, Inc.

Terms of Service / ©2023