Anyone notice the last two 4hr candle are similar. Any importance of that?
Ignored
Check out the very first page of the James16 chart thread and look at his chart on that page. It looks like that to me! Trend continuation pattern. Am I correct in this thought or no? If anyone could steer me right if I'm not, it is much appreciated.
I think the long will be good........ but I still haven't received confirmation as we have not had a close above the 1h 100sma yet. We could be heading back to 202.70s once again soon in order to pick up more buyers.
Check out the very first page of the James16 chart thread and look at his chart on that page. It looks like that to me! Trend continuation pattern. Am I correct in this thought or no? If anyone could steer me right if I'm not, it is much appreciated.
Ignored
for that to be a trend continuation pattern, this 4h candle needs to close above 203.71... the fourth or the confirmation candle of that type of pattern has to be the highest in terms of closing price. this pattern usually indicates a retracement or price gathering of momentum. and would usually look like a normal swing low and sing higher high on a smaller TF
for that to be a trend continuation pattern, this 4h candle needs to close above 203.71... the fourth or the confirmation candle of that type of pattern has to be the highest in terms of closing price. this pattern usually indicates a retracement or price gathering of momentum. and would usually look like a normal swing low and sing higher high on a smaller TF
Looks like we found some buyers at 202.80 last time...higher lows each time, so like you say hopefully dip 30/40 pips from here (presently at 203.36) and we're off North...but of course the beast could just fart in my face and head South instead LOL...
Looks like we found some buyers at 202.80 last time...higher lows each time, so like you say hopefully dip 30/40 pips from here (presently at 203.36) and we're off North...but of course the beast could just fart in my face and head South instead LOL...
Ignored
I think it will go up based on the bullish engulfing candle on the yen daily and the cable also looks set to rise to 1.9750 area. Also the geppy 4h looks quite bullish. I am just waiting on a break and close above the 1h 100sma. I think the RICS house price balance will inject some pace in the movement......
I think it will go up based on the bullish engulfing candle on the yen daily and the cable also looks set to rise to 1.9750 area. Also the geppy 4h looks quite bullish. I am just waiting on a break and close above the 1h 100sma. I think the RICS house price balance will inject some pace in the movement......
Ignored
Just a few points for bear action:
- 4h stochastics ob
- geppy daily very bearish
- triple top on 15m
I am waiting to play it either way.....but I think the bull looks stronger short term.......We'll see...
lol. with ur experience i'm sure u already knew that. i just went ahead and explained it for those who don't
Ignored
by the way, i would like to add something else that i noticed myself (i think)
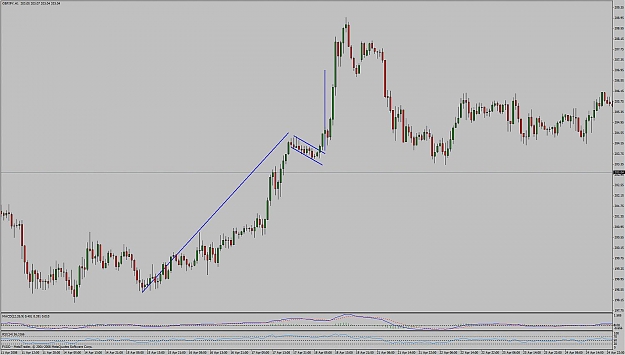
in this very type of trend continuation pattern, the price goes up just as much as it did before that pattern started to form, and also in a very close timeframe (in terms of time not chart TFs). now, that upwards movement started from 200.15 all the way to 203.71 about 350 pips. now if this candle confirms and breaches 203.71 then the price will shoot up 350 pips from the "Bottom" of that candle. in english, if this is really a trend cont pattern, then we are looking at 206-207 areas. BUT BUT BUT BUT, there is one other condition that the CURRENT pattern also didn't finish yet, THE TIMEFRAME. the price has 12 hours limit to finish this cycle, otherwise it will be delayed or achieved after another major retracement.
here's an example of a good pattern that i pointed out during the 1100 upwards movement of last month. oh yea, i also remember something about someone owing me dinner at that time? memory problems i guess
by the way, i would like to add something else that i noticed myself (i think)
in this very type of trend continuation pattern, the price goes up just as much as it did before that pattern started to form, and also in a very close timeframe (in terms of time not chart TFs). now, that upwards movement started from 200.15 all the way to 203.71 about 350 pips. now if this candle confirms and breaches 203.71 then the price will shoot up 350 pips from the "Bottom" of that candle. in english, if this is really a trend cont pattern, then we are looking at 206-207 areas. BUT BUT BUT BUT, there is one other condition that the CURRENT pattern also didn't finish yet, THE TIMEFRAME. the price has 12 hours limit to finish this cycle, otherwise it will be delayed or achieved after another major retracement.
here's an example of a good pattern that i pointed out during the 1100 upwards movement of last month. oh yea, i also remember something about someone owing me dinner at that time? memory problems i guess
I thought this explanation would cast light on your discovery.
What you are referring to here is called flag pattern in TA. Viewing on 1h chart we can see price forms flag pattern (on 4h too but more clearly on 1h).
How to measure potential TP trading those flag;
Half of flagpoles seize (last bull/bear run which is this case is 600 pips) so if you cut your TP by half, you have done it correctly after "the book".
In some cases price would go longer as here, but in most scenarios you wouldn't push it too far without any profit taken of the table.
Have u ever worked with Keanu Reeves, Harrison Ford, Jet Li? How do u think of them?
Ignored
Never worked with any of these 3, but I do have some dousy stories about Harrison Ford, as I've worked with his wife.... errr Calista......
Funny stuff.........
I've worked with Alex Winter (Bill and Ted, Keanus buddy) a bunch and met Keanu. Nice guy. Gets a bad rap I think.
|
Membership Revoked
|
Joined Apr 2008
|2,468 Posts
What do you think to the divergence you see on the 4hr with the Zero lag MACD and last 2 candles? Trying to post a chart but having problems with the net at the moment. If someone could have a look at the 4hr I'd appreciate it....