Nice profit. Can you explain how you determine the trend for each pair? The key to success is the get the trend right at first place. Appreciate your input.
Any indicator will to the trick. use it in a daily and you will see where the price is going or simply print the chart and draw a line connecting the prices and show it to a 5 year old ask her " is the line I draw goin up or going down?"
LOL. She'll tell you
Any indicator will to the trick. use it in a daily and you will see where the price is going or simply print the chart and draw a line connecting the prices and show it to a 5 year old ask her " is the line I draw goin up or going down?"
LOL. She'll tell you
Ignored
dont think its that easy for this reason: Everyone says its easy to see a trend. "If the price on the left of screen is lower than the price on the right, then the trend is up". But I have often struggled with that idea because the the trend changes depending on the length of time (number of bars) you have on your screen.
Also how can u quickly identify the trend is abt to chg.
Ignored
Get a Slope Directional Line Indicator put it in your chart and that will tell you the direction and the color will tell you if it is changing already. Never mind the color of your candle. The are oftem times misled you. There is another one Mega Trend Indicator or any trending indicators. They do the trick.
Sorry Hansel, you were not paying attention..
Remembe we were up around 800 pips before Tuesday then it start dropping .. at the sign of dropping more thatn 300 we close the trades. The we reopen and the same thing happend .. we close with a small profit.. o remember even CJ just was able to get a few. Then we are not trading until there was a reversal of the JPY crosses suppose to be Thu (LondonOpen) but did not happend until 9:00 am. I traded long on those JPY crosses, then there was this reversal again. i personally was up 0ver 400 then close the trade before it become negative just took around 200 only. The I made another trade again this morning and now i am 335 pips up and about to close it by 3:50 today.
Ignored
I know - you're right. I should have closed way sooner. I'll just try again next week and hopefully make back what I lost.
Get a Slope Directional Line Indicator put it in your chart and that will tell you the direction and the color will tell you if it is changing already. Never mind the color of your candle. The are oftem times misled you. There is another one Mega Trend Indicator or any trending indicators. They do the trick.
Trader101, is there a reason why you trade the pairs you trade?
my question is based on the fact that we got burned on the JPY pairs .
So, i guess, having LESS pairs based on JPY could help the set.
Suggestions are welcome from everyone... on trying to find the perfect correlation of pairs that will keep the loose/win ratio (within a set of open trades) fully hedged.
my fear is this : if you take eurjpy, gbpjpy, and nzdjpy in the same direction, and that happens to be wrong, then the other pairs would really have to rack up some decent profits in order to just balance out the super-loss of the volatile yen pairs.
just my 2 cents... opinions welcome.
Ignored
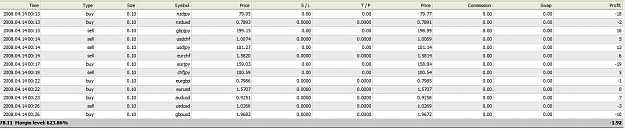
If you notice my last trade, not all JPY pairs are in the same direction i could have more pips collected have i put the NJ and AJ in the same direction as GJ and EJ and the rest. I did that for a reason..hedging i know the JPY pair are on sell push but i keep 2 on the buy mode. To balance in case i made a mistake. The trade before last if you notice also the EU is in a different direction as the GU .. GU is selling and EU is buying and the other 2 AU and NU. Have you been observing my trade closely it is always like that. But if the signal is really strong then thats the time i put them all in one basket. The selection of this currencies is solely base on their spread and their volatility. its up to you which of those currencies among the group will be your balancer. Do this when there is little doubt in the currency moves. If they are ranging it is hard to tell where they are going, that is the time i put a currency or two to act as the hedger. CJ -- i admire you for being innovative and always looking for ways to improve your trading. this suggestions was very good and intuitive, however i have covered already, i suggest you do the same.
If you notice my last trade, not all JPY pairs are in the same direction i could have more pips collected have i put the NJ and AJ in the same direction as GJ and EJ and the rest. I did that for a reason..hedging i know the JPY pair are on sell push but i keep 2 on the buy mode. To balance in case i made a mistake. The trade before last if you notice also the EU is in a different direction as the GU .. GU is selling and EU is buying and the other 2 AU and NU. Have you been observing my trade closely it is always like that. But if the signal is really strong then thats the time i put them all in one basket. The selection of this currencies is solely base on their spread and their volatility. its up to you which of those currencies among the group will be your balancer. Do this when there is little doubt in the currency moves. If they are ranging it is hard to tell where they are going, that is the time i put a currency or two to act as the hedger. CJ -- i admire you for being innovative and always looking for ways to improve your trading. this suggestions was very good and intuitive, however i have covered already, i suggest you do the same.
Ignored
thanks for the reply trader101.
i made a mistake on the JPY pairs, and to tell you the truth : i havent noticed your other JPY trades in the opposite direction. ( actually, i havent even read the whole trade,so, not sure if u explained it earlier ).
thanks for the tip. i surely will put this to the test, starting sunday night.
cj.-
It's been good to get the perspectives from traders like CJ, Imbiber, and others. This thread is getting better all the time, and I've learned a lot, even in the past week. Looking forward to starting a new week of trading.
Nice profit. Can you explain how you determine the trend for each pair? The key to success is the get the trend right at first place. Appreciate your input.
It's been good to get the perspectives from traders like CJ, Imbiber, and others. This thread is getting better all the time, and I've learned a lot, even in the past week. Looking forward to starting a new week of trading.
Ignored
like i've told the people who have PM'ed me : there is no magic trick in this business. I'll be more than glad to help anyone with ALL the questions you may have... but i will never say : at point X is a good buy or good sell.
Let's all learn together and enjoy the ride.
and always remember the main subject of trader101's thread : keep it simple. no more than an indicator or 2 , and all in all simple support, resistance and pullback, then go with it and count your pips after u close.
here's my first "tutorial" if you will, on how i determine the trend.
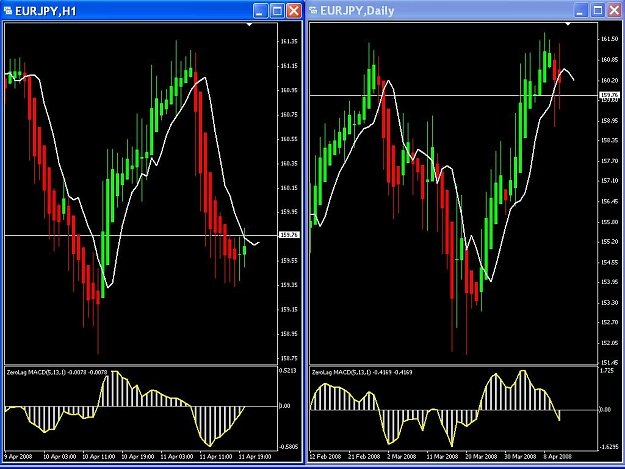
#1 first of all, i only use the daily, and if that's not too clear, the weekly.
(anything less than this, is just to get a SPECIFIC entry and not DIRECTION of the trend )
#2 i try to view levels of support and resistance with my own eyes, most of the times, these levels match perfectly with 21-EMA or 50-EMA which you see in my chart ( 21 is white, 50 is blue , 8 EMA yellow for short term trend )
In this example i've marked the specific entries i've would have taken with the stop just a bit above the EMA, after the daily bar closes.
remember the following formula SHOULD always be present :
#1 determine trend ( in this example is an OBVIOUS short all the way )
#2 wait ( on your favorite time frame ) for a rally IN THE OPPOSITE DIRECTION of the trend determined in step #1
#3 once this rally is over, and it starts on the way of the main trend again, just enter at the market price....with the stop above the high of that swing.
once this is done, just sit on your hands and hope that the trend determined in step #1 is the valid trend.
no indicators, no "tricks", good ol' support and resistance trading -- and of course the trader101 magic of pair selection.
the second one of my tricks that i'll share with you guys, is right on my charts :
Charts of OIL, GOLD and Dollar INDEX.
OIL and GOLD are probably the most sought-after commodities on the planet.
their price movements, more often than not, affect the commodity dollars : CAD, NZD and AUD.
CAD usually follows OIL, the other 2 usually follow GOLD.
and GOLD most of the time goes opposite of the dollar index.
what does this mean ?
if GOLD rallies in the middle of the night....
short the dollar ( long euro, long aussie, long kiwi, short yen, short swiss , long cable, you get the idea )
if the dollar index rallies to a major resistance, short the dollar same way as above.
if the dollar sells of hard ( hopefully you make money on this ) to a previous support, go long the dollar ( short euro, short gbp, and so on ... )
if the dollar makes new lows (which is the case, nowadays ) , don't mess with it -- JUST GO WITH IT
I see what you are saying. I am curious though, how you determine when a rally is over, and is not just a temporary dip. Do you have an amount that the price goes down before you make that judgement?
In your example of the USD/CHF, the trend is short, as you said, but the price rose over 150 pips on Thursday, before coming starting to come down again yesterday. At what point would you say the rally is over and you would be OK to go short again?
Ignored
to determine : do this ....
choices for you :
if you're looking at 1H charts : wait for 3 hours AGAINST the rally, then go with it.
if you're looking at 4H chart, wait for a 3-bar break out : that is , a bar that that break the low of the past 2 bars ( in case of looking for a short entry )
if you're looking at the daily, just see if price has reached one of the key EMA leves (8,21, 50 , or whatever your choice may be ). wait for the daily CLOSE. then go with it.
hope this clarifies,
CJ.-
Ignored
Hey CJ
you are becoming a master trader now. On behalf of the young traders reading this thread, thank you for your support of them. Always hope they come out good out of these advices.
Ok I will be trading daily which will eventually become a Long Term Trades, when the market open. I will also try to give signals for the intraday trading this week. Also i will continue the forward testing of the New EA which i named "Traders Delight". I will attached the program later for every one to demo as well. This is more or less our program for the week and hopes we make more pips this week than last week.
Ok Here is the EA for testing:
Specification:
Pairs to trade: GU, GJ, UJ, AJ, EJ & GC (exclusive)
Trade Time: All times
Extern Var: lot set @ 0.1, SL set @ 300, TP set @ 300
Time Frame: 1 hour (strictly)
Indicators Reqd: Normal Indicators (that comes with the MT4Platform)
Minimum Equity : $3000.00
EA Status: Backtest complete, Forward test in progress
Close Trade On Friday: Manually b4 close or leave it open.
QuickStart setting: False (default)
EA expiry: 5-10-2008
Expection : 100 pips per pair per week
Notes: Please do not change the SL and TP. Keep it open even during Newstime.
Ignored
Minor change: Same settings except the QuickStart Setting: true (default)