Not the first time 200.90 area turns out to be a hard nut to crack. Combined with fibo level, which have been posted in here this evening, makes 200.90 as strong resistance for now.
Price have also start to form flag-pattern on 30m chart with a good flag-pole revealing atleast 100 pips breakout-target.
Can anyone confirm possible divergence on 30m and soon 1h chart ? Or am I way off ?
Ignored
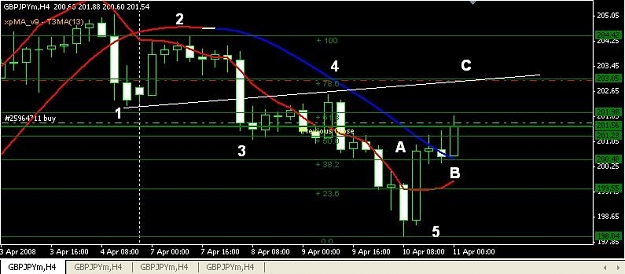
Here's what I see - everything pointing down. . . Right now I'm convinced it an ABC correction and looks to be in Wave B now. . .
1hr and 4hr calling for price @ 199.60's-200.00 later 2nite. Then I see a move back up to at least 202.35 - 203.20 area. . .
Then after that a continuation of the down trend to 192 area 1st. . . Of course this will be done in 5 waves down. . .
What I see is that the down channel just readjusted and became steeper.
Don't know how to post chart. Can anyone explain please?
Ignored
Dmac, when you are making your regular post there is a little paper clip, beside the smiley face in the posting menu bar. Just click on it and it will open up a window for you to upload your chart.
If you use mt4, just right click on your chart, and you will have the option to "save as a picture" . If you don't use mt4, you may have to use print screen or screen capture software (like snag-it) and then use Microsoft's default paint program to adjust the size of your chart. Then you can upload it using the paper clip link, previously mentioned.
P.S. If you don't see the paper clip, change your web browser. It might not be visible in FireFox.
Here's what I see - everything pointing down. . . Right now I'm convinced it an ABC correction and looks to be in Wave B now. . .
1hr and 4hr calling for price @ 199.60's-200.00 later 2nite. Then I see a move back up to at least 202.35 - 203.20 area. . .
Then after that a continuation of the down trend to 192 area 1st. . . Of course this will be done in 5 waves down. . .
Just my take on it. . .
Ignored
Yeah, seems eager for a drop now. My breakout-target for downside is 199.50 so almost same as your target. We are soon on the thirded closed bar below 4h resistance, so I must admit it would be "surprising" if price decides to go north before south, IMO.
Yeah, seems eager for a drop now. My breakout-target for downside is 199.50 so almost same as your target. We are soon on the thirded closed bar below 4h resistance, so I must admit it would be "surprising" if price decides to go north before south, IMO.
Ignored
took very small [email protected] target is 197 with 50 pip stop loss. low risk high reward.
Trading inside a range with that big targets sounds risky. 1:7 R/R you say ?
Also, why did you enter short when price was near to bottom of this range?
Time have teach me that aiming for such great R/R is very hard.
Ignored
Made a lot of money today. The amount I risked was nothing. But with that being said obviously I was wrong. Already stopped out. Will definetly wait on side lines now. Thanks