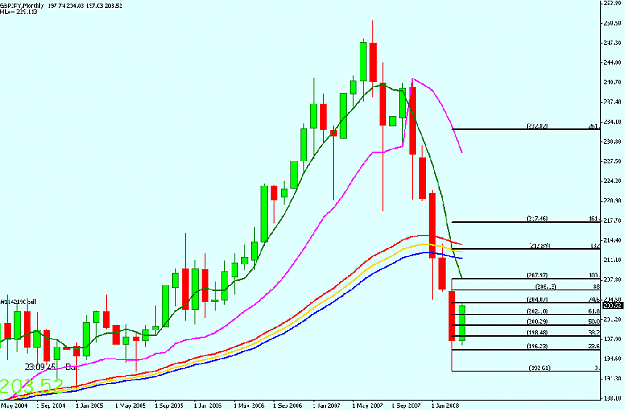
- #71,642
- Apr 2, 2008 3:35pm Apr 2, 2008 3:35pm
- Joined Jan 2008 | Status: Only God Can Judge Me | 2,467 Posts
- #71,657
- Edited 4:49pm Apr 2, 2008 4:39pm | Edited 4:49pm
- Joined Oct 2007 | Status: Trader | 5,510 Posts
Auslanco-GBP/JPY Strength Indicator strategy 345 replies
Auslanco 15min GBP/JPY startegy 630 replies
My MT4 indicators for Auslanco's strategy 92 replies
Auslanco 15 minute Strategy Oanda FXManager Updates.. 62 replies
Questions About Auslanco's Trades 72 replies
Dislikednot now. at the break of 203.15, I'm planning on sending a scout. Just to get a feel for it. if it works out then i'll add more lots later. As for the target of 206.xx, I think I may have found out why you were looking at that area. Perhaps, you were thinking we are in wave 4 in monthly chart? please correct me if i'm wrong.Ignored
DislikedHere are the levels I look at. . . The fib is from the bottom to where the fall began. . . Typically if one is broken then the other is seen at some point. That's why I said if 204.30/50/70 area is broken then there is a good chance that 206 would be seen. Also, 206 is weekly R3 as well, then daily R3 is 207.74 which is 100% retrace from where the fall originated. . .
Hope this helpsIgnored
DislikedIMO, everything looks to be overbought. perhaps it may drop down a little then head back up? Then again I can be completely wrong. thanks for the heads up.Ignored
DislikedHere are the levels I look at. . . The fib is from the bottom to where the fall began. . . Typically if one is broken then the other is seen at some point. That's why I said if 204.30/50/70 area is broken then there is a good chance that 206 would be seen. Also, 206 is weekly R3 as well, then daily R3 is 207.74 which is 100% retrace from where the fall originated. . .
Hope this helpsIgnored
Dislikedor the price fall we just saw down to 203.20 area could have been the retrace for now. . . retraces can be 50%, 38% or even 23.6% which this was exactly 23.6%. . . We may see price go to 204.30/50 area before going down futher. . .Ignored
DislikedHi all.
Looking at the big picture, this whole up movement was caused by price making a double bottom at 192.60 area ( this can be seen on monthly chart).
If you draw a fib extension on last month you will see that price has just touched the 74.6 level.
For me this means that at least a down retracement is due. However, the daily bar still doesn't indicate a strong down reversal so i may consider a retest of the high after a retracement is over.Ignored
DislikedThanks Q, now I understand why. As for the target of 204.50, do you think it would still be valid even if the daily closes below 203.50, which just did as I was typing?Ignored
DislikedSomething wrong went with FF and they gave a different username.
here is the chartIgnored
DislikedOkay, I just got my new daily pivots and here it what I see. . .
A 1hr close above 203.50/55 with the next bullish candle opening above the 1st will see 204.60 area. . .
A break and closed below 202.75 area will see 201.50 area before we see any more upside. . . 201.50 is 38% retrace of the entire bullish run, starting from 197 area. . . A 50% retrace down with 5 wave downs would be bearish for this pair. . . We should expect to see 3 waves down (correction) if the bullish upmove is to continue.
Just my two cents. . .Ignored
DislikedHi Q.!Sorry for the artless question but,why 5 waves down is a bearish sign?Ignored
DislikedThat's the rule's of Elliot wave theory. . .
Typically if a bull run has ended we would see 5 waves down then the correction would be 3 waves up (up, down, up), then u would continue with that trend which would be down. . .
Now in our case the trend seems to be up (for now or short term) so if the trend is to continue we should see a 3 wave correction down (down up, down), then it should continue with the main trend which in our case we hope is up. . . (then you would see 5 waves up to complete that wave cycles. . .
Hope this helps. . .Ignored