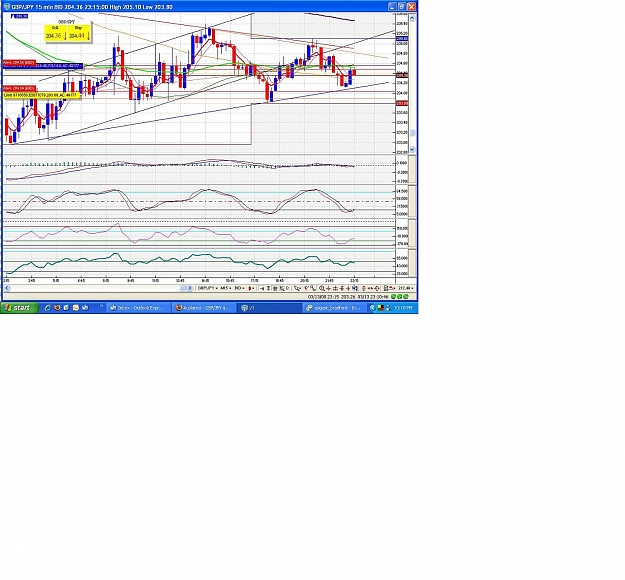
I dont see anything but bearishness on my weekly chart.
1. price is trading below the 5 sma low.
2. 3 of the 4 moms pointing down, and all are below 100.
3. 5 sma close is crossed down below the 5 sma open.
4. cluster res sitting above.
5. 3 waves down from 251 area.
6. if this candle closes below the previous week's candle, this is bearish.
1. price is trading below the 5 sma low.
2. 3 of the 4 moms pointing down, and all are below 100.
3. 5 sma close is crossed down below the 5 sma open.
4. cluster res sitting above.
5. 3 waves down from 251 area.
6. if this candle closes below the previous week's candle, this is bearish.
Attached Image (click to enlarge)