Joined Apr 2007
|
Status: HARD SHYT SCUBA TRADER
|20,886 Posts
just price action is telling you what is going on here.'
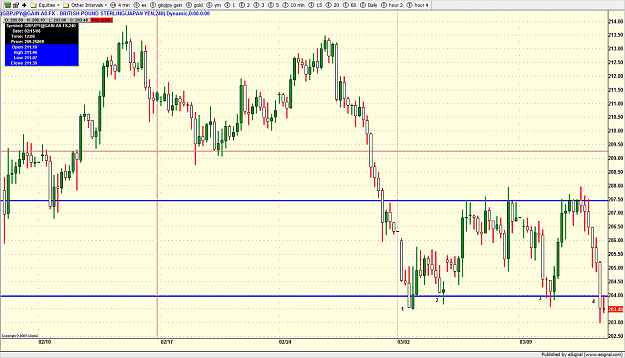
Here is naked chart.
Do not think of 203.5 , or 203.37 as support. Really support and resistance are 'zones' . There was an interesting article in this in Stocks and Commodities magazine not long ago. Charting is not precise as lot of traders think. Do you think 205.5 or 205.478767? 205.5 right .....just to show you how to simplify things.
The real support zone is 203.5 to 204... now forming resistance.
Also on 1, 2 and 3 look how the price came down in to the support zone gently. If you zoom in on a 15 min chart you will see that the level of 203.5 was barely broken before buyers stepped in on the next 15 min candle.
This time we broke 203.5 on the 15 min and are now retesting the top of resistance zone at 204.
Any longs here are at high risk ..... the price action alone ie VERY bearish.
I am not a bull or bear ... I traded the hell out of the indexes today both side on a 2 min chart.
I can see that a lot of traders in here are being fooled , and there are newbie traders in here who blindly follow others leads.
If you must get into a long wait for a confirmation trend reversal on a 30 min.
Note for all longs out there .... we have not even broken the 10 sma on the 30 min yet.
Hi Jarroo, is your long still in?
I couldn't sleep watching the price actioning
I somehow managed to exit my previous long with one plus pip..wheww. Today's bearishness is unbelievable.. I gotta to trust my chart now. No bottom top picking anymore.
It would seem so.. considering a break of the 100 level, which is a very important psychological level. However, I trade fundamentals.. not numbers.. so I just look out for important news or reports related to banks, hedge funds, etc. What if UJ breaks through 100 and BoJ decides to dump a lot of Yen to restrict the fall? Then UJ will shoot back up..
I tend to wait for a rally, and then short.. Every time GJ goes up 200-300 pips.. I short.. that's what I've been doing. These pairs have fallen pretty hard today so far.. of course, there's room for much more, but I'm staying on the sidelines for now.
The US retail sales will be interesting to watch.. as it might just fuel further market sentiment for bears to push carries even lower.
Ignored
Your analysis makes sense to me. Especially because it matches my own. Ha. I fear that I missed the big move today and could easily get wiped out by going short this late in the game, if some quasi-government yen selling or dollar buying hits.
Hi Jarroo, is your long still in?
I couldn't sleep watching the price actioning
I somehow managed to exit my previous short with one plus pip..wheww. Today's bearishness is unbelievable.. I gotta to trust my chart now. No bottom top picking anymore.
Ignored
Yeah, I'm still long at 203.50 I took half off for 41 pips the other half still s/l at 202.90. This is a small position as I stated earlier. Its a high risk trade played on a whim. I don't pick bottoms either. I hate smelly fingers.
Indicators show the past. Price Action "Indicates" the future.
just price action is telling you what is going on here.'
Here is naked chart.
Do not think of 203.5 , or 203.37 as support. Really support and resistance are 'zones' . There was an interesting article in this in Stocks and Commodities magazine not long ago. Charting is not precise as lot of traders think. Do you think 205.5 or 205.478767? 205.5 right .....just to show you how to simplify things.
The real support zone is 203.5 to 204... now forming resistance.
Also on 1, 2 and 3 look how the price came down in to the support zone gently. If you zoom in on a 15 min chart you will see that the level of 203.5 was barely broken before buyers stepped in on the next 15 min candle.
This time we broke 203.5 on the 15 min and are now retesting the top of resistance zone at 204.
Any longs here are at high risk ..... the price action alone ie VERY bearish.
I am not a bull or bear ... I traded the hell out of the indexes today both side on a 2 min chart.
I can see that a lot of traders in here are being fooled , and there are newbie traders in here who blindly follow others leads.
If you must get into a long wait for a confirmation trend reversal on a 30 min.
Note for all longs out there .... we have not even broken the 10 sma on the 30 min yet.
can you link to a description of how you trade the 2 min charts? time frames that short scare me in my old age but I am interested in how you manage it
hi malcolmb14 , weekly candle chart is forming a bearish candlestick pattern with high reliability and high power .im reciving signals .so im come back to home with my chickens that changed to bird and rooster .
hi malcolmb14 , weekly candle chart is forming a bearish candlestick pattern with high reliability and high power .im reciving signals .so im come back to home with my chickens that changed to bird and rooster .
Ignored
i hope police arrest you with your dangerous and cruel chicken handling
if it breaks 100 does it keep going or bounce back? that will make or break the g/j trade today
I have no idea, but the chances are high for a big intervention if the 100 big figure is broken
fair warning today
Ignored
we had this discussion yesterday already the ding dongs are not planning on intervening at the 100 level according to bloomberg article posted yesterday..........
we had this discussion yesterday already the ding dongs are not planning on intervening at the 100 level according to bloomberg article posted yesterday..........
Ignored
yet 4 hours in a row now the price has dropped to 101.01 and then bounced up
however, it is getting late in japan so who knows once the sake kicks in
can you link to a description of how you trade the 2 min charts? time frames that short scare me in my old age but I am interested in how you manage it
thanks, greg
Ignored
Lol old age and trading 2 min chart do not go hand in hand...... heart attacks are common.
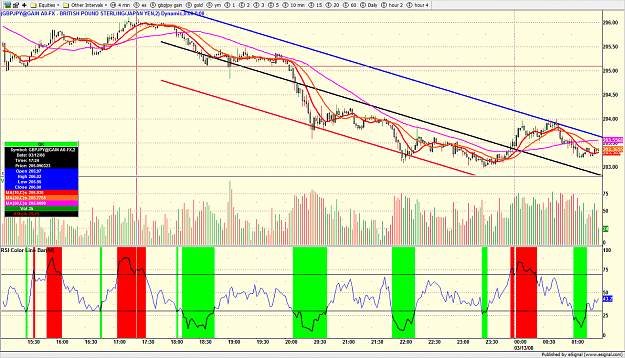
2 min chart , rsi , 10,20 and 50 sma and a lienar regression channel.
sell as close to 206 , 40 pips stop. rsi trigger 01
cover 205
sell on failed break out of 10,20 . 50 sma at 19:30 , cover 204, (posible 60 more pips on this trade)
buy trigger 20:00 , 20 pips stop, sell when it came back down thru 10 and 20 sma , small loss 20 pip
buy trigger 22:00 as close to 203.10 as posisble. 20 pips stop , sell 204
sell trigger rsi red at 0:00 , sell as close to 203.9 as possible 20 pip stop
still in short
100 +125-20+90+70 , 365 pips possible , with planned trades , overall move was 400 (300 down and 100 up).
Disclosure I did not trade this, but this is to give you an idea.
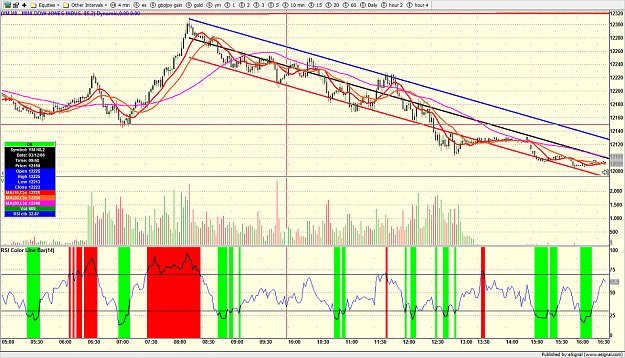
My trading plan for this week is to focus on YM only on day trading. 2nd chart is the 2 min channel I played. 300 points , on a 200 point drop.