Did you find it difficult to trade this week? Also, is your girlfr still trading using the 50 sma and the RSI14 trading above 50 or below 50? About a week ago you mentioned that you had taught her this method and she made 300 pips/gbpjpy. I'm wondering how it went this week. Thanks...I so enjoy reading your posts....
Great thread Malcolmb! I have a quick question if you dont mind answering. On your 1-2-3 set up for a long, where is your buy signal? Is there a certain place you place a buy? (or sell for a short 1-2-3 set up)
PipChick
Ignored
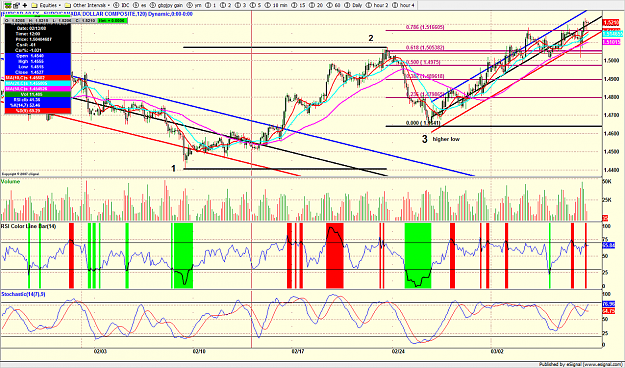
I call it a 1-2-3 but , idealy you are getting in at 3 (lower high for sell or higher low for buy). The 1-2-3 are really only pivotpoints and rsi should indicate that they are forming. Therefore i use rsi triggers to enter the trades.
Example:
On the eurcad trade below on the 2 hour chart there was a buy trigger on the 2 hour with a trigger bar high of 1.4756 , entry 50 pips higher ( due to longer time frame and for confirmation of trend continuation) at 1.4810. Max draw down 80 pips. This also formed the higher low giving the '3' on the 1-2-3 buy trigger , thus enabling me to put my fib extensions on the set up for targets.
As you can see they have worked very well so far. We are right above the 71.8% right now , typically when this break we go to 127%
Once I am in profit I move stop to 2 fib extensions below price ( stop at 1.4975 right now). I will exit the trade only if I get a short trigger on the 4 hour by either RSI or a breakdown thru the bottom of the Linear regression channel.
So now I am going to have a deluge of question of ' how do I trade breakouts of a linear regression channel'
LR channels are just a support and resistance line , that is all .. nothing fancy. If the price breaks down through the bottom of the channel it could be a sell trigger , so same as for RSI triggers : if price breaks down through the botttom of the LR channel go short 50 pips lower than the low of the trigger bar for 2 hour charts and higher time frames.
THIS IS A SIMPLE CONCEPT
Please let me explain
The idea to adding pips to the high or low of the trigger bar , weather it be MACD , stochastics , adx , moving average crosses , price breakouts , channel breakouts , fib breakouts , and the other 400 plus indicators out there ... is to make sure that the trigger is not a false trigger and in fact the trend is changing.
Most traders say get in at the best price you can.
I would rather miss a few pips and wait for trend confirmation , that way I get stopped out less often.
malcolmb, your RSI is overbrought will you expect some sore of retracing since your are long? i want to jump in hehe
Ignored
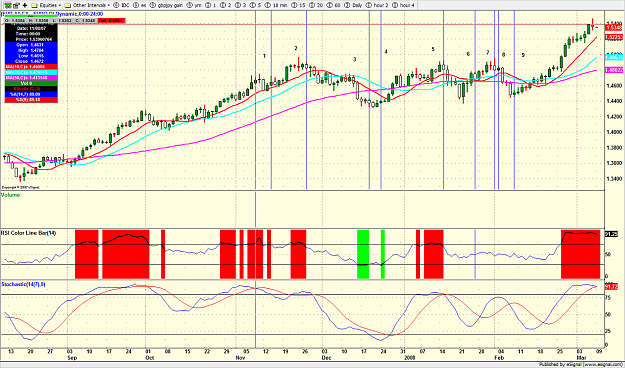
Ok here is why you look at mutilple time frames and why I have stochastics on the chart.
RSI is consdiered one of the few leading indicators out there.
Stocahstics is a lagging indicator.
60 min shows long trigger , entry was 1.5170
2 hour show sell trigger 1.5110 sell entry but the stochastics are still pointing up so I think this is a false trigger.
4 hour sell trigger 1.5167 , entry 50 pips lower at 1.5111 ( matches 2 hour trigger). But again stochastcis pointing up.
Plot 14 , 7 , 9 stochastic on your charts and have a look
You could go long now , with stop belwo 1.5000 ( psychological barrier) .... 210 risk for 260 pips reward. Or you could wait till I post next short trigger and see if it gets filled for a better risk / reward.
Did you find it difficult to trade this week? Also, is your girlfr still trading using the 50 sma and the RSI14 trading above 50 or below 50? About a week ago you mentioned that you had taught her this method and she made 300 pips/gbpjpy. I'm wondering how it went this week. Thanks...I so enjoy reading your posts....
Ignored
this week was ok
My woman has moved on to the YM (dj-30 e mini futures) as she likes to trade between 11am and 1pm pacific. I found this is better for her as there is always a little volatility coming into the close of market.
She is doing well trading only the RSI method and using fib channel break outs.
She has only traded three time .. each day she made some... about 100pips per day average as the YM ( dj futures ) really move and groove.
She is grasshopper. .... she has good Master.
We spend a little time going thru trades in the evening of the day that she traded.
If someone figures out how i can share my charting software for free via the internet so others can see and use headphones at same time I will put on a ' chart show' 2 hours a week .
I will not be able to do it during my trading time as I am VERY busy making $$$$$$$$$$$ (or at least trying to )
Ok here is why you look at mutilple time frames and why I have stochastics on the chart.
RSI is consdiered one of the few leading indicators out there.
Stocahstics is a lagging indicator.
60 min shows long trigger , entry was 1.5170
2 hour show sell trigger 1.5110 sell entry but the stochastics are still pointing up so I think this is a false trigger.
4 hour sell trigger 1.5167 , entry 50 pips lower at 1.5111 ( matches 2 hour trigger). But again stochastcis pointing up.
Plot 14 , 7 , 9 stochastic on your charts and have a look
You could go long now , with stop belwo 1.5000 ( psychological barrier) .... 210 risk for 260 pips reward. Or you could wait till I post next short trigger and see if it gets filled for a better risk / reward.
on higher timeframes like 30/1hr you also add/subtract 15pips or more? Can you ellaborate a little on this issue.
Cheers!
Ignored
10 min , 15 min , 20 min and 30 min 25 pips
60 min to 6 hour 50 pips
I do not trade higher time frames than this due to the draw down you can get on your account. Trading daily charts on gbpjpy you need a 400 pip stop . Now that is just insane.
eurusd is muc more friendly to trade on longer term time frame if you do not have all day to watch the computer.
Daily though could be 100 pips
Here are 9 trades on eruusd form Nov to now. . They netted 2203 pips. Draw down 100 pips only. i have omitted the 1 in fornt of the numbrs for speed of typing ie actual reading on chart 1.4597 abbreviated to 4597.
1 . st ( sell trigger) low = 4597 , entry 100 pips lower @ 4497 no fill
2 . st 4808 , entry 4708 , subsequent low 4400 , 300 pips
3. no trade ( not filled hence 100 pips)
4. bt high 4413 , entry 4513 , subsequent high 4919 = 400 pips
5. st low = 4801, entry 4701 , subsequent low 4400 = 300 pips
6. bt high = 4778 , entry 4878 , subsequent high 4956 = 80 pips
7. st 4956 , entry 4856 , subsequent low = 4440 = 400 pips
8. bt 4849 , entry 4949 , no fill preivous short trigger remains in play.
9. bt 4549 , entry 9646 , current price 5400 ... still in play for 750 pips
trades 6,7,8 and 9 are rsi crossing 50 triggers.
2230 pips
557 pips per month
av 28 pips per day
NO LOSSES....
this is beacuse we chose the right pair to apply the daily technique to. Apply this to gbpjpy and see how big the draw downs are and how many losses you get. LOL position traders on GBPJPY are just greedy (and I am not sure they understand the concept of compounding your profit in a lower risk pair)
boys and girls ..... are you sitting down
I hope so
start with 10 mini lots , reinvest 50% of profits on each trade , those 9 trades would net you ......I think the math is right $598,000 assuming 1 pip per mini lot = $1 ,
using a 100 pip stop the worst that would happen is that you started with your initial investment of $1000 ... even if you got stopped out on the last trade.
I call it a 1-2-3 but , idealy you are getting in at 3 (lower high for sell or higher low for buy). The 1-2-3 are really only pivotpoints and rsi should indicate that they are forming. Therefore i use rsi triggers to enter the trades.
Example:
On the eurcad trade below on the 2 hour chart there was a buy trigger on the 2 hour with a trigger bar high of 1.4756 , entry 50 pips higher ( due to longer time frame and for confirmation of trend continuation) at 1.4810. Max draw down 80 pips. This also formed the higher low giving the '3' on the 1-2-3 buy trigger , thus enabling me to put my fib extensions on the set up for targets.
As you can see they have worked very well so far. We are right above the 71.8% right now , typically when this break we go to 127%
Once I am in profit I move stop to 2 fib extensions below price ( stop at 1.4975 right now). I will exit the trade only if I get a short trigger on the 4 hour by either RSI or a breakdown thru the bottom of the Linear regression channel.
So now I am going to have a deluge of question of ' how do I trade breakouts of a linear regression channel'
LR channels are just a support and resistance line , that is all .. nothing fancy. If the price breaks down through the bottom of the channel it could be a sell trigger , so same as for RSI triggers : if price breaks down through the botttom of the LR channel go short 50 pips lower than the low of the trigger bar for 2 hour charts and higher time frames.
THIS IS A SIMPLE CONCEPT
Please let me explain
The idea to adding pips to the high or low of the trigger bar , weather it be MACD , stochastics , adx , moving average crosses , price breakouts , channel breakouts , fib breakouts , and the other 400 plus indicators out there ... is to make sure that the trigger is not a false trigger and in fact the trend is changing.
Most traders say get in at the best price you can.
I would rather miss a few pips and wait for trend confirmation , that way I get stopped out less often.
Joined Apr 2007
|
Status: HARD SHYT SCUBA TRADER
|20,886 Posts
I did this compounding thing .....
Got scared at 70 k and took profit.
Now i do something a little different where I increase lot size every month. I day trade with 10 - 20 lots depending on how the markets are behaving. For example Friday was only 10 , as although gbpjpy was ripping there was a lot of volatility.
The thing is that if your 1st trade is profitable and you can use a 100 pip stop then you will never lose your initial investment.
Ok sceanrio 2 ... you only reinvest 25% of the profit
less risk ... 125 pips stop
1 k to 110,000 in 4 months.
All you need do is pick the pairs you want to trade the longer term time frame on . Sure they are not as exciting as gpbjpy but they will make money for you if you approach the trading in right manner and have a plan.
For your homework .. apply the daily technique to usdchf.
Use rsi 50 crosses also..... bear in mind that it is in a STRONG downtrend
My woman has moved on to the YM (dj-30 e mini futures) as she likes to trade between 11am and 1pm pacific. I found this is better for her as there is always a little volatility coming into the close of market.
She is doing well trading only the RSI method and using fib channel break outs.
She has only traded three time .. each day she made some... about 100pips per day average as the YM ( dj futures ) really move and groove.
She is grasshopper. .... she has good Master.
We spend a little time going thru trades in the evening of the day that she traded.
If someone figures out how i can share my charting software for free via the internet so others can see and use headphones at same time I will put on a ' chart show' 2 hours a week .
I will not be able to do it during my trading time as I am VERY busy making $$$$$$$$$$$ (or at least trying to )
Ignored
Imagine a couple hours a week live!!! watching Malcolmb's chart show.
My woman has moved on to the YM (dj-30 e mini futures) as she likes to trade between 11am and 1pm pacific. I found this is better for her as there is always a little volatility coming into the close of market.
She is doing well trading only the RSI method and using fib channel break outs.
She has only traded three time .. each day she made some... about 100pips per day average as the YM ( dj futures ) really move and groove.
She is grasshopper. .... she has good Master.
We spend a little time going thru trades in the evening of the day that she traded.
If someone figures out how i can share my charting software for free via the internet so others can see and use headphones at same time I will put on a ' chart show' 2 hours a week .
I will not be able to do it during my trading time as I am VERY busy making $$$$$$$$$$$ (or at least trying to )
Ignored
:surprised Nice! If you do this, I'll be one of the first people there.