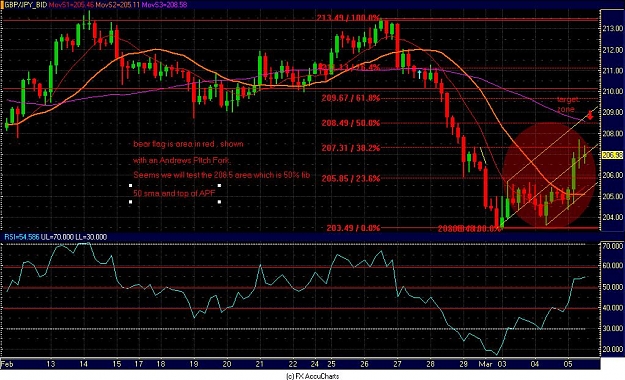
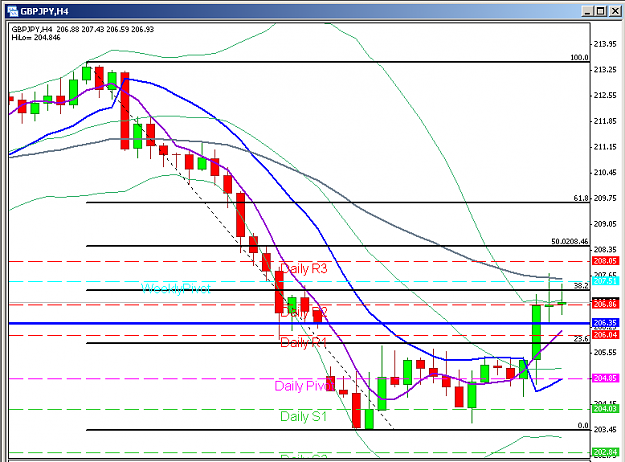
Price break out of pattern and formed a new resistance @ 207.42. Not seeing upside (short-term based) safe before usdjpy breaks above 104.15 and gbpjpy above 207.42, IMO
Measure twice, cut once
Auslanco 15min GBP/JPY startegy 630 replies
Auslanco-GBP/JPY Strength Indicator strategy 344 replies
My MT4 indicators for Auslanco's strategy 92 replies
Auslanco 15 minute Strategy Oanda FXManager Updates.. 62 replies
Questions About Auslanco's Trades 72 replies
DislikedI'm not familiar with bear flag. would you mind giving me some examples or guide me where to look into this? Thanks in advance.Ignored
DislikedHere is the bear flag on the 4 hour. Once this is broken to the down side typically you see a move as long as the flag pole , which happened to be 1000 pips.
The area shown in red is a bear flag , the flag pole is 213.5 to 203.5.
The yellow lines are an Andrews PItch Fork. (they just form support and resistance).
The interesting thing about the 4 hour is the double spinning top dojis right under the 38% Fib retracement, the 2nd one being an inside bar as well. If I saw this pattern in a stock I would be shorting the hell out of it,
I have heard GBPJPY is notorious for fake out doji's . Can anyone tell me of their experience with this ?
We will either break out of 207.31 overnight if GBP interest rate is good and test 50 % fib at 208.5 ish , or the double dojis will play out and we test 205.5 zone. If 205.5 zone is broken hold on for the ride.
AttachmentIgnored
DislikedWe are gonna have a wild ride in the next few days. Hang on to your horse!!!Ignored
DislikedAnyone joining this IB scalp... ? The Bulls are gone to bed:-) hurry before they wake
http://www.alkaspace.com/free/spit_i...f0e3c929669e00Ignored
DislikedInside Bar? What inside bar? Where?
Funny how the candles look different depending on the MT4 time zone eh?
I have a demo open with InterbankFX and they are GMT (0 time zone).
What time zone are your charts?Ignored
DislikedWe are gonna have a wild ride in the next few days. Hang on to your horse!!!Ignored
DislikedOn the daily geppy, we had a close above the 5 sma high. I see some upside potential, but i will sell any rejection along the way.
target is the 22 sma (green) at 209.57 area, or the brown 55 sma around 210.54.
1 candle mom shows a reload before the push.
14 and 5 candle are a bit bullish. She just tested the bottom of the channel and she may want to test the upside of her channel, before dropping hard to test the lows again.Ignored
DislikedHere is the bear flag on the 4 hour. Once this is broken to the down side typically you see a move as long as the flag pole , which happened to be 1000 pips.
The area shown in red is a bear flag , the flag pole is 213.5 to 203.5.
The yellow lines are an Andrews PItch Fork. (they just form support and resistance).
The interesting thing about the 4 hour is the double spinning top dojis right under the 38% Fib retracement, the 2nd one being an inside bar as well. If I saw this pattern in a stock I would be shorting the hell out of it,
I have heard GBPJPY is notorious for fake out doji's . Can anyone tell me of their experience with this ?
We will either break out of 207.31 overnight if GBP interest rate is good and test 50 % fib at 208.5 ish , or the double dojis will play out and we test 205.5 zone. If 205.5 zone is broken hold on for the ride.
AttachmentIgnored