• Home
  • Forums
  • Trades
  • News
  • Calendar
  • Market
  • Brokers
  • Login
  • Join
  • User/Email: Password:
  • 11:44pm
Menu
  • Forums
  • Trades
  • News
  • Calendar
  • Market
  • Brokers
  • Login
  • Join
  • 11:44pm
Sister Sites
  • Metals Mine
  • Energy EXCH
  • Crypto Craft

Options

Bookmark Thread

First Page First Unread Last Page Last Post

Print Thread

Similar Threads

Price pattern scanner where I choose the pattern 4 replies

Pattern's Chemo-Electric Trading Journal 1,013 replies

chart pattern trading 5 replies

Michael's CHART Pattern trading is back! 0 replies

Weekly trading signal and pattern 0 replies

  • Interactive Trading
  • /
  • Reply to Thread
  • Subscribe
  • 248
Attachments: Pattern Trading
Exit Attachments

Pattern Trading

  • Last Post
  •  
  • 1 2Page 3456 22
  • 1 2Page 34 22
  •  
  • Post #41
  • Quote
  • Mar 3, 2008 6:26pm Mar 3, 2008 6:26pm
  •  fiveshorts
  • | Joined Sep 2007 | Status: Where there's cash there's hope. | 84 Posts
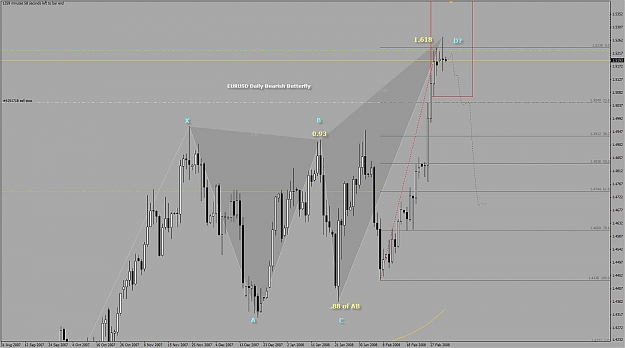
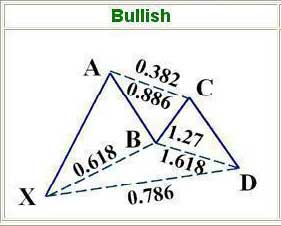
And, while I'm at it, this ZUP indicator is labeling the above pattern as a Bullish Butterfly, when the B point only just makes it to a .618 XA retracement level. The required RT is .786, no? So how faithful is the indicator anyway?

I do bang on, don't I.
 
 
  • Post #42
  • Quote
  • Mar 3, 2008 6:37pm Mar 3, 2008 6:37pm
  •  smalldog2
  • | Membership Revoked | Joined Jun 2007 | 114 Posts
Patterns are curious things, sometimes they work othertimes they fail. Now what we want to understand if why they fail. This will save us a packet trading.

Using the indicators with no education and you might as well take the opposite trade you will be 50-50 anyway. The trick is to understand why it works.

Ratios in the legs are of prime importance I am sure, lets see if we can find failure patterns and identify a common theme, so we can avoid them in future trades.

Answers... paterns are based on extremes of waves so my thinking is that only the extreme points of the wave form are valid, just because a point makes a pattern does not mean it is really there, I see this indicator pull up patterns all day, I trade maybe one in 4, why because they look right, and I have read a couple of books on the subject. Yes I get it wrong but by controlling my risk I can make money every day.

PM if you want more information.


Smalldog
 
 
  • Post #43
  • Quote
  • Mar 3, 2008 9:57pm Mar 3, 2008 9:57pm
  •  fiveshorts
  • | Joined Sep 2007 | Status: Where there's cash there's hope. | 84 Posts
Smalldog2.

Whatever it takes. I'm happy to post all my trades and maybe-trades and no-trades right here for comment.

I've started running ZUP v64 through the Strategy Tester to try and get a feel for when a pattern is not a pattern and vice versa. It's a real education to see a Gartley appear on a chart, then, as the chart evolves, see it disappear again a in just a few bars...

As far as I can see, we can only benefit from a proactive critique of setups, so bring it on. The best idea I can think up is to post patterns as found by the ZUP indicator and then break them down for content...? Then see where they lead.
 
 
  • Post #44
  • Quote
  • Mar 3, 2008 10:07pm Mar 3, 2008 10:07pm
  •  fiveshorts
  • | Joined Sep 2007 | Status: Where there's cash there's hope. | 84 Posts
Here's the first then:

EURUSD Daily chart.
ZUP v64
Bearish Butterfly

Now, according to Scott Carney, the perfect Bearish Butterfly has a B point retracement at .786. this one hits 0.93, so I don't know if it even qualifies as a bearish butterfly at all...
The AC retrace is spot on at 0.88
And the potential D point looks good at 1.618
But what about that peak between C & D? Does that count?
What about the length of time in bars from C to D?
The huge sell off between C & D, does that negate the pattern?

Putting my ignorance on show for all to see....
Attached Image (click to enlarge)
Click to Enlarge

Name: EURUSD_butterfly.jpg
Size: 87 KB
 
 
  • Post #45
  • Quote
  • Mar 4, 2008 5:01am Mar 4, 2008 5:01am
  •  Peter Pan
  • | Joined Jan 2007 | Status: LEAD, FOLLOW or get OUT OF THE WAY | 59 Posts
fiveshorts,
it's running fine here on 3 different mt4 installations.
Did you enable DLL in the common tab ?

Cheers,
PP


Quoting fiveshorts
Disliked
Thanks Peter Pan, but the v76 isn't loading on my Mt4...? I re-compiled it and it's in my Custom Indicators list, but nothing shows up on the chart when I apply it. Is it working for you? Is there something new I need to set to have it work?

Also, does anyone have a reader on what's new & improved in this version?

Many thanks
Ignored
 
 
  • Post #46
  • Quote
  • Mar 4, 2008 8:41am Mar 4, 2008 8:41am
  •  fiveshorts
  • | Joined Sep 2007 | Status: Where there's cash there's hope. | 84 Posts
Quoting Peter Pan
Disliked
fiveshorts,
it's running fine here on 3 different mt4 installations.
Did you enable DLL in the common tab ?

Cheers,
PP
Ignored
I can't believe it... I hadn't enabled DLL... makes we wonder how I ever manage to place a trade without having my hand held...

Thanks for the help — it's working perfectly now.

Do you know of anywhere that goes into the features/improvements of each new version?
 
 
  • Post #47
  • Quote
  • Edited at 2:39pm Mar 4, 2008 1:45pm | Edited at 2:39pm
  •  fiveshorts
  • | Joined Sep 2007 | Status: Where there's cash there's hope. | 84 Posts
Not sure if I'm talking to myself here, but...

Here's a newly identified GBPCHF H1 Bullish Bat trade, maybe?
The textbook D-point reversal is at the 0.886 level of XA (marked on the chart). So, does one wait for perfection to go long, or not?
What would be the entry/stop/target rules be if this does play out to be a real Bat?

btw/fwiw, the ZUP identifies this as a Bullish Gartley... go figure.
Attached Image (click to enlarge)
Click to Enlarge

Name: GBPCHF_H1.jpg
Size: 128 KB
 
 
  • Post #48
  • Quote
  • Mar 4, 2008 2:37pm Mar 4, 2008 2:37pm
  •  fiveshorts
  • | Joined Sep 2007 | Status: Where there's cash there's hope. | 84 Posts
A tasty Bullish Deep Crab?

Daily EURCHF
Everything seems to point to this rare pattern?
Comments?
Entry point? Stops are easy to determine?
Reversal signs?

Hey am I on my own here?
Attached Image (click to enlarge)
Click to Enlarge

Name: EURCHF_D1.jpg
Size: 164 KB
 
 
  • Post #49
  • Quote
  • Mar 4, 2008 2:52pm Mar 4, 2008 2:52pm
  •  weetikveel
  • | Joined Dec 2007 | Status: Member | 59 Posts
Quote
Disliked
Hey am I on my own here?

I'd like to help you mate, but I don't know nuthing about the subject...
I'll be following it closely however, very interesting subject!
 
 
  • Post #50
  • Quote
  • Mar 4, 2008 3:27pm Mar 4, 2008 3:27pm
  •  weetikveel
  • | Joined Dec 2007 | Status: Member | 59 Posts
Guess this should be helping you a bit further:
http://www.forex-tsd.com/harmonic-trading/

regarding
 
 
  • Post #51
  • Quote
  • Mar 4, 2008 7:15pm Mar 4, 2008 7:15pm
  •  fiveshorts
  • | Joined Sep 2007 | Status: Where there's cash there's hope. | 84 Posts
So, as I waited for perfection (the D point turning at 0.886) I watched the turn happen without me (at about .764) for a cool 140pips and counting...

What can we learn from this? Let's discuss. Did the pattern 'work'? Or is this rally a 'failure' of the Bullish Bat in this instance?

If a reversal candlestick pattern occurs prior to the ideal PRZ, does one jump in? So many questions. Where is everyone?

I'm starting to believe that the PRZ is bigger than I first believed and that waiting for perfection is going to cost me...? If AB and BC are accurate legs, then the PRZ is assumably more flexible?
Attached Image (click to enlarge)
Click to Enlarge

Name: GBPCHFb_H1.jpg
Size: 117 KB
 
 
  • Post #52
  • Quote
  • Mar 4, 2008 9:05pm Mar 4, 2008 9:05pm
  •  fiveshorts
  • | Joined Sep 2007 | Status: Where there's cash there's hope. | 84 Posts
Quoting weetikveel
Disliked
I'd like to help you mate, but I don't know nuthing about the subject...
I'll be following it closely however, very interesting subject!
Ignored
Thanks, I was just moaning 'cos everyone seems to skulked off somewhere else, leaving me to be the ONLY harmonic trader in the entire world...
 
 
  • Post #53
  • Quote
  • Edited at 11:23pm Mar 4, 2008 9:08pm | Edited at 11:23pm
  •  fiveshorts
  • | Joined Sep 2007 | Status: Where there's cash there's hope. | 84 Posts
I just purchased and read Scott Carney's excellent Harmonic Trading books. Here's an email I just sent to him for comment, based on my first attack at understanding Gartley's... maybe someone here has some wisdom too:

"I'm a novice Harmonic Trader, but not a novice trader. I've been trying to work through your 'rules' for pattern ID in a systematic and visual way, so that the knowledge is embedded in my brain. With that in mind, I re-interpreted the Bullish Gartley diagram (attached) so I could come to terms with the reversal points and have hit a problem that I was hoping you could clarify for me...?

Given that the C point can legitimately form anywhere between 0.382 and 0.886 of AB (shown as the C zone), and that our D point can legitimately form anywhere between 1.27 and 1.618 of AB (the D zone) ... How can D ALSO obey the requirement of forming exactly at 0.786 of XA?

1.618 of AB takes it way beyond 0.786 of XA, surely? Particularly if C has turned at 0.386 of AB in the first place...

In other words, C at 0.386 AB + D at 1.618 AB = approx 100% of XA

I'm confused. What am I not understanding?

Respectfully"
Attached Image (click to enlarge)
Click to Enlarge

Name: BullGartley2.jpg
Size: 56 KB
Attached Image
 
 
  • Post #54
  • Quote
  • Mar 4, 2008 11:59pm Mar 4, 2008 11:59pm
  •  bunjow
  • | Joined Oct 2007 | Status: Member | 103 Posts
Quoting fiveshorts
Disliked
... How can D ALSO obey the requirement of forming exactly at 0.786 of XA?

1.618 of AB takes it way beyond 0.786 of XA, surely? Particularly if C has turned at 0.386 of AB in the first place...

In other words, C at 0.386 AB + D at 1.618 AB = approx 100% of XA

I'm confused. What am I not understanding?

Respectfully"
Ignored
Well that's just it.

The way that fib's (or pivot points for that matter) work is that they define an aprox. AREA and not an EXACT number per say.

For example, the price could fall in the middle between the 61.8 and 78% marks but be closer to the 78 mark so you would generally call that a 78.6% retracement.

Same goes if the price overshoots the 78.6 towards the 88.6 (but is still closer to the 78.6) it would still be considered a valid 78.6 retracement.

So when you consider that there is a certain amount of SLACK allowed with all the retracement measurements that leaves you with a considerable PRZ sometimes.

And yes, C at 0.386 AB + D at 1.618 AB could = 100% of XA but it could also fall short of 78.6 of XA (if the AB retracement of XA was not EXACTLY 61.8 bang on, it would throw off all the other measurements plus the slack that they allow as well)

The only thing for certain is that for all the patterns (with the exception of the crab or the extreme butterfly) the D zone (PRZ) CANNOT exceed the X point or it would invalidate it. (good place for a stop loss right?)

Honestly, I have not been that successful with these patterns but I am watching this thread with interest to see if anyone else is.

(I used to post these patterns on this thread if you're interested in how I had viewed them: http://www.forexfactory.com/showthread.php?t=9978 )

Good Luck.
 
 
  • Post #55
  • Quote
  • Mar 5, 2008 12:31am Mar 5, 2008 12:31am
  •  fiveshorts
  • | Joined Sep 2007 | Status: Where there's cash there's hope. | 84 Posts
Firstly, thanks for taking the time to respond. I was beginning to feel like a mouse in an empty warehouse...

Quote
Disliked
The way that fib's (or pivot points for that matter) work is that they define an aprox. AREA and not an EXACT number per say.

Yes well that's where I'm fighting this, as the 'textbooks' seem to be calling for rigorous precision with the reversal points... I'm trying to drill down to the optimum interpretation, if you will.

Quote
Disliked
So when you consider that there is a certain amount of SLACK allowed with all the retracement measurements that leaves you with a considerable PRZ sometimes.

Indeed. My point exactly.

Quote
Disliked
Honestly, I have not been that successful with these patterns

I'm sorry to hear that... I'm persevering with them in the hope that there's enough to base a long term strategy on. I have a basic belief in the theory behind them, I just want to define my wiggle room on each pattern.


Quote
Disliked
Good Luck.

And to you.
 
 
  • Post #56
  • Quote
  • Mar 5, 2008 5:03am Mar 5, 2008 5:03am
  •  Peter Pan
  • | Joined Jan 2007 | Status: LEAD, FOLLOW or get OUT OF THE WAY | 59 Posts
fiveshorts,

the programmer and the board where it's from is in russian..
if you can translate it, I am sure it will delight us :-)

http://onix-trade.net/forum/index.ph...ndpost&p=72865


I sadly had only half a year of russian...long time ago ...

cheers,
PP


Quoting fiveshorts
Disliked
I can't believe it... I hadn't enabled DLL... makes we wonder how I ever manage to place a trade without having my hand held...

Thanks for the help — it's working perfectly now.

Do you know of anywhere that goes into the features/improvements of each new version?
Ignored
 
 
  • Post #57
  • Quote
  • Mar 5, 2008 5:22am Mar 5, 2008 5:22am
  •  weetikveel
  • | Joined Dec 2007 | Status: Member | 59 Posts
Look at the pattern on the G/U 1H, it's a bullish gartley, price broke through pivot support 2, and found support.
Real buy moment?
 
 
  • Post #58
  • Quote
  • Mar 5, 2008 5:35am Mar 5, 2008 5:35am
  •  Peter Pan
  • | Joined Jan 2007 | Status: LEAD, FOLLOW or get OUT OF THE WAY | 59 Posts
Hmm..difficult one I'd say..

It would have been a perfect pre-news entry long a minute before ) 9.30 UK..
it was PMI services which surprised to the upside with 2 deviation.

Cheers,
PP

Quoting weetikveel
Disliked
Look at the pattern on the G/U 1H, it's a bullish gartley, price broke through pivot support 2, and found support.
Real buy moment?
Ignored
 
 
  • Post #59
  • Quote
  • Mar 5, 2008 5:49am Mar 5, 2008 5:49am
  •  weetikveel
  • | Joined Dec 2007 | Status: Member | 59 Posts
Problem seems to be 1.9800 border... if it doesn't brake through, can we expect another wave down?
 
 
  • Post #60
  • Quote
  • Mar 5, 2008 6:16am Mar 5, 2008 6:16am
  •  Peter Pan
  • | Joined Jan 2007 | Status: LEAD, FOLLOW or get OUT OF THE WAY | 59 Posts
whilest 00 is a psychological level,

GU has the tendency to break the 00 rather quickly, usual stronger levels coming upwards are 92, then 07 above and finally around 15 level on the way up.
From 15 it then retraces back to 00 very often....just my experience.

Looking at the daily chart, GU would be (as it was since a few days) ready to go south, whilest strong CHF and EUR were able to move quite substancially..GU was trading in a range with some minor breakouts (considering closes of candles, rather than the wicks..)

GU Reached S3 today..so I'd rather wait for the afternoon session with a few US indicators to see if it can reach any R levels to short there (longer term trades)

my 2c
cheers, PP

Quoting weetikveel
Disliked
Problem seems to be 1.9800 border... if it doesn't brake through, can we expect another wave down?
Ignored
 
 
  • Interactive Trading
  • /
  • Pattern Trading
  • Reply to Thread
    • 1 2Page 3456 22
    • 1 2Page 34 22
0 traders viewing now
  • More
Top of Page
  • Facebook
  • Twitter
About FF
  • Mission
  • Products
  • User Guide
  • Media Kit
  • Blog
  • Contact
FF Products
  • Forums
  • Trades
  • Calendar
  • News
  • Market
  • Brokers
  • Trade Explorer
FF Website
  • Homepage
  • Search
  • Members
  • Report a Bug
Follow FF
  • Facebook
  • Twitter

FF Sister Sites:

  • Metals Mine
  • Energy EXCH
  • Crypto Craft

Forex Factory® is a brand of Fair Economy, Inc.

Terms of Service / ©2022