Great idea bobokus! I look forward to following your thread!

Trading with Price Action - Daily Trading Analysis 80 replies
Daily Highs and Lows to Previous Daily Highs and Lows 1 reply
dx and ex daily and EU daily 2 replies
Day Trading vs. Swing Trading vs. Position Trading 84 replies
GBP/USD daily pip movement vs. EUR/USD daily pip movement 3 replies
DislikedBefore I sleep here's one thing I saw when I pulled up a chart and looked at a random spot. If this fib were part of a retracement or the start of a new down move (I didn't look long term to see how it fits in), then the pull back upward retraces to the inner fibs within an upward range that becomes clear as time goes on.
There's lots of high and low candle breaks as one clue to the range period. When clear boundary lines can be drawn, a break of the range coinciding with fib levels may be a good time to get in.
In this case the range is broken to the down side on the circled candle, and this coincides with a 38.2 bounce. Taking the break of the low and trailing the stop behind the candles gives a good move. There's lots of penetrations and bounces in & around the fib levels but once the noise clears up, the true fib bounce/break is seen.Ignored
DislikedI backtested on GU from April to Dec 06, about 9 months and the results are quite encouraging : profit 8100pips 40 winners and 7 loosers (82%), max drawdown 370 pipsIgnored
DislikedIs that the number of pips from beginning to end of a certain trade range, or is that counting each of the 3 lots as a separate pip count?Ignored
DislikedSo for each trade I considered the total result of the 3 lots : 47trades of 3 lots each, ranging from worse case -369 to best case + 832 for a total over the 9 months of backtest of over 8100.Ignored
DislikedI'm still not sure I got it, but here's an example...
A trade is taken long at 2.0000 with 3 lots.
First lot is sold for +50 at 2.0050
Second lot is sold for +100 at 2.0100
Third lot rides until finally stopped for +200 at 2.0200
So the range of price was 200 pips from 2.0000 to 2.0200
But between 3 lots there was a pip gain of 50 + 100 + 200 = 350
So is 8100 calculated based on my example of all 3 lots gain of 350 or just the price range of the trade for 200?Ignored
DislikedYes 8100 is calculated based on your example of all 3 lots gain of 350.Ignored
DislikedNow I know a little better how to compare that method to just using hourly for the way I trade hourly (which is different and probably less profitable than the main hourly method being taught). I've been averaging around 150 a week for a few months, which I can only hope would hold up in the long term, so that's 600 a month, or 5400 in 9 months (single lots). But I'd rather just say 100 a week and 400 a month as a conservative average, so that's 3600 in 9 months conservative single lots.
I'm always searching for a way to avoid sitting at the screen all night (East coast Canada time zone) with a higher time frame. When I was considering the 4 hour charts I still found myself always needing to watch them. I'm hoping to learn to use daily as a lowest time frame...so I really don't have to monitor it until end of day.Ignored
DislikedWere you looking at every candle in the day or just certain time of day? With hourly I only take trades from 12am to 12pm EST and after a "big" move has occurred in the day, I don't usually do anything further, so sometimes I could be done the day within a few hours and not have to sit too long.
I even have a concern about using daily candles - if I have to be there to check at the start of each one, that would be early evening for me and as bad as it sounds, that could interfere with the very freedom that daily charts would give. If I wanted to be away from home out doing something, I would suddenly need internet access at 6pm or 5pm. Too bad it's not midnight.
I guess there's always iphone or blackberry...but I'm getting ahead of myself!Ignored
DislikedI am a bit confused...
Do you sit the whole day in front of your pc?
Or only a few times a day?Ignored
DislikedWere you looking at every candle in the day or just certain time of day? With hourly I only take trades from 12am to 12pm EST and after a "big" move has occurred in the day, I don't usually do anything further, so sometimes I could be done the day within a few hours and not have to sit too long.
I even have a concern about using daily candles - if I have to be there to check at the start of each one, that would be early evening for me and as bad as it sounds, that could interfere with the very freedom that daily charts would give. If I wanted to be away from home out doing something, I would suddenly need internet access at 6pm or 5pm. Too bad it's not midnight.
I guess there's always iphone or blackberry...but I'm getting ahead of myself!Ignored
DislikedHi Bo and everyone,
I have been a long time student/lurker of your other thread after following Skunny thread all along. I have even re-traded the first month of your thread on Vhands, reading your comments "live" afterwards. It's a great technic and you're a great teacher and I learned a lot.
I tried to adapt the technic to the daily for the same reasons that everybody here (I live on the west coast of Canada and I'm not far to get sick if I don't allow myself a little more sleep) but I was put off by the huge range, so I devised a method for H4 which I backtested on GU from April to Dec 06, about 9 months and the results are quite encouraging : profit 8100pips 40 winners and 7 loosers (82%), max drawdown 370 pips and I was discovering the technic to apply as I was going so there was more loosers in the beginning. I used 3 lots for each trade, with progressive TP and SL...
The interesting thing is that in H4 the intraday becomes the intraweek and the swing fib is of the same range than the intraday... but I didn't used them exactly the same way...
Trading H4 is a lot about learning not to trade, because some ranging situations can last more than one week, the trades can last up to that much too. (those ranging to avoid in H4 would have been probably fine to trade in M15...)
With this in mind I can gess that the scale for daily will be the Intra-month with trades lasting for few weeks to more than a month and periods over a month without a trade.
Anyway I'm going to read your documents and report.
Actually I wouldn't mind trading side by side the daily, the H4, and when I can the H1 or more realistically with my schedule, Islander's M15/M5.
millions of pips to you.
I would be interested to compare the average amount of pip you can make for the same period in H1 versus H4 or Daily. In the thread somewhere, you wrote it was something like for time as much in H1 than in Daily, do you think it's a realistic figure?
Schmurex
PS can somebody direct me to the link for the video, I didn't see the last one.Ignored
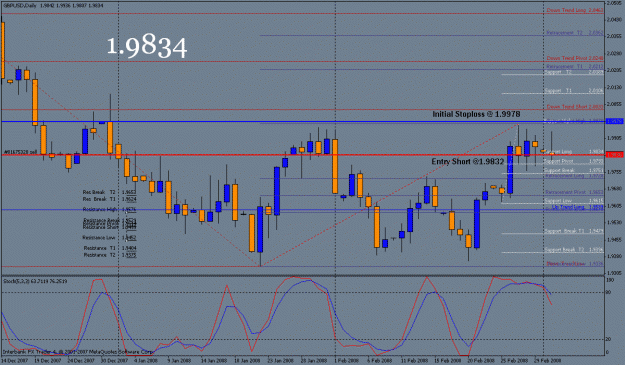
DislikedJust to get things started, Ive set a sell stop below Sundays low and it has been picked up and the Stop almost hit already. Its early to jump in since the market has been ranging but i would like to see losses as well as winners to help make decisions on how to handle them. 1 solution is to monitor the 4hour and the 1 hour when making the decision the enter each day as you make your analysis and set the entry and stop points. I was going to wait until we had some direction but the management of losses is also as important as letting the winners run, so all options must be explored.
Comparing the waveforms developing from the 4 hour and 1 hour I think will help as we make our analysis each day.
For this entry I set the Stop 8pips above the high made back on 2/27(1.9978), and the Sell stop @ (1.9832). Looking at the last few days from the Daily, support levels from the fib measuring this last leg up price made are holding and pushes are being made to attempt a break on this previous high but each time the high is lower until today that was quickly turned away.
The Stoch is rolling over but cant be trusted yet as price is not agreeing.
At the close today and open of the next Daily candle, I may adjust the stoploss since price has yet to pentrate very decisively the support levels of the this last move up yet, hinting they may not be done yet with the pushes up. Ideally we would like to see price retreat some into the levels of this fib just enough to bring the stop loss down closer to price.
In the next post we'll look at the 4hour and 1 hour to help with our decisions.
Ive aslo posted a template of the Daily as seen here so anyone that wishes to help develope this Daily strategy your more than welcome here, problem is we do not want to weigh it down with indicators as it will confuse the set up. The basics work best in the long run.Ignored
Dislikedeven though it is metastock the daily candles print differently, enough it would appear , to be a problem.Ignored