http://img183.imageshack.us/img183/5606/68433900ws3.jpg
Hi guys,
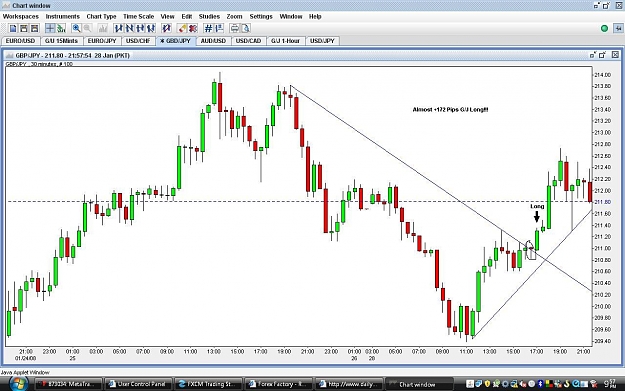
Note the chart above. There is a potential trade in play.
I’ve specified the Take profit, stop loss and entry levels.
I’m sure by now you’ve noticed that when the market is ranging and we have defined R and S levels between which traders can open orders and liquidate their positions, things are very easy.
Traders interested in buying, do so at the Bottom of the channel, where there is the most buying pressure and sell at the first logical take profit level which is the channel’s High or Resistance.
The closer it gets to the top, the more interested the buyers become in taking their profit, the less interest they have in buying anymore near the top or adding to their position on dips on lower time frames, at the same time those who missed the entry because their pre-trade risk evaluation does not allow a 1:1 due to the large SL being so far away from the lows now wait for reversal confirmations around the top to start selling with their first take profit target being the bottom of the channel…
If only trading were this easy every time and the market only moved sideways, we’d know where to buy every time and where to sell. We would never loose. Unfortunately things aren’t always so rosy. It is extremely important to keep in mind the fact that as yourself the people on the other side of the deal are also human, with common needs; they need a safe place to enter which will provide minimal risk over their capital via a small stop loss and a good place to exit. What I am trying to emphasize on here is that in order for the price to move, it needs reason, it needs motivation. For someone to do something he/she needs a goal. In the forex market or as far as we are concerned as individual traders and from an enclosed technical view, these goals are R and S levels, areas at which the buying and selling interests change due to logical stimuli.
If the price were to start trending up, don’t just say, the price is trending up. Ask yourself why, say to yourself, if this person was me, and I bought and moved the price, where would I want to exit ? Where would sellers become interested in selling, where would my price most likely start reversing on me? Find these support areas, find these resistance areas. If something moves, it has a goal, find it on the chart.
In a trending market things tend to take another turn. Determining potential reversal areas demands the use and application of varying tools. Since there is no strongly defined area of initial take profit for buyers, like Strong resistance and Strong support for the sellers a different psychology needs to be understood in order to adapt a system to the current situation at hand efficiently.
In order to understand how a trend works, you need to take a look at the underlying anatomy of price movement and introduce yourself to Higher Highs, Lower Lows, Lower Lows, Lower Highs and what constitutes the start and reversal of a trend. I sent you guys some books the other day. One of them by Pring explains the essentials needed to grasp the essence behind these particular price movements. I strongly recommend that you familiarize yourself with this.
In every scenario we have in the market ie, down trend, uptrend or sideways movement a different set of principles are applied in order to take advantage of what is happening. We know that in a channel, sellers will enter shorts near a high where they have small risk and buyers will enter near the low. In an uptrend however, and this applies vice versa to a downtrend, we are unable to rely on the same probability of reversal using the former principles of movement. To determine profit taking levels you need to be able to read a chart well and know when it is showing clear signs of reversal through the use of supplementary tools like candlestick charts and western technicals.
http://img526.imageshack.us/img526/5016/70326559fn2.jpg
In the downtrend to the left you will notice that buying at the lows of X would not have been a problem at the beginning of the trend as we at had a considerably reliable prior area of support to take into consideration when guaging market interests and valuating the probability of a reversal; point Y. As I mentioned before, you need to ask yourself what every responsible trader will; “Where will my stop loss be?”, “Where will I secure my profit?”. Our SL here is placed below there areas Y and X which are lows and represent a price value area at which sellers will not have an interest in selling due to the lack of a professionally sound area to place a stop loss that can be relied on. No one will be selling there, I mean, where would they place their SL !? – in the middle of the movement ? – No way!
The people that cause the penetration of lows and highs in a range vary. They can be economic events and news releases which change the interests of buyers and sellers. At this point taking into mind the prior statement, it is possible that unlike before, more sellers are now interested in selling at the lows, as they have a longer term goal that outweighs that which we are able to perceive as intra-day traders. People who were within the range, now have more “reason” to be continuously aggressive in buying around the highs or selling around the lows, rather than covering their positions, because the expectations have changed and interests outweigh each other causing a dis-balance in the market. When this happens abruptly, stops can be taken out which further more piles up the directional momentum, adding additional fuel to the fire, causing the start of a new trend. Illustratively, buyers at X, maybe initially had plans to take profit at Z, but were encouraged by events or factors inexplicable to us that invited more buyers at the highs of Z and disinterested more sellers from entering causing an overload in bias. Other reasons can be organized sells and buys by banks and large corporations and organizations around the extremities of these price movements. Lurking in the quiet shadows, an organized sell at point X, where small buyers are coming in due to the low risk high probability trade, could dump the price just enough to cause panic, influence closing long positions and possibly even take out stops, in doing so short circuiting the price and the expectations drawn out by human psychology its self.
Their aim is to get enough little fish on the hook to pile up as bait so the hook can perpetually weight itself lower to the SL, where the big shark takes a bite. The more SLs that are hit the more the price will move in the opposing direction of fresh buyers at point X, because when you Buy and set a SL order, for your platform to execute it, it needs to hit Sell to complete the two way transaction between the buyer and the seller. Taking out stops, piles up selling pressure in a buying scenario. At this point the crowd splits into groups. The lows are violated, SLs are possibly taken out. The organized sell that short circuited the SLs does not invest any more into the sells, they wait on psychology to do the beating and allow the combined market fear to fulfill the pseudo-realistic-self-beneficial prophecy on its own. At this point people are panicking, some are selling to liquidate their longs with small losses, others still have hope, and some know exactly what is going on, so they hold their long positions attempting to minimize any contribution to additional selling pressure that may cause even more buyers to unwind.
The psychology behind price movement can become very complicated if you make it, as with everything else in forex, or it can remain very logical as it naturally is. Everyone has a breaking point and despite what I’ve described here, there is no accurate price value for buyers at X to determine when it's best to give up on the long. This is chaos. The only way we can control it is by accepting that we can’t. In doing so we learn to control ourselves instead. We learn to hold our SL, we learn to let our profits run, we understand that the difference between being on top is no longer about winning every time, because you know that it is impossible. It’s just a matter of consistency.
Understanding the little patterns, hints and signs and taking advantage of them allowing statistical probability to carry us to gains at the end of the month. The worst thing you can do is create the illusion of control in this market. Nobody is safe, but by applying very basic logical take profit, buying and selling principles all based on the primal feelings of fear and greed you will succeed.
Now back to the chart. If you bought at Y you would need a target. The same way you need some sort of hold (resistance in a buying scenario) over which to throw a grappling hook and pull yourself to the highs, the same way you need a resistance area or technical number when you’re buying to pull yourself up to successfully and most importantly with a probability of success. With the probability of that being the best place for your grappling hook to lodge itself visually. A decision based on the safety of your life (Fear), primal feelings; "If i hook here, will the rocky and uneven wall allow me to climb up faster than my competitor or slower" (Greed). The decisions we make are a fine balance between these two emotions.
For a good buyer at Y a sensible take profit level would be Octothorpe 1 or 2. Why ? – because it’s the most logical and technically sain thing to do. Now, how do you know if it is going to go to Octo 1 or Octo 2 ? – There is no way you can say, but you can consider the following when doing so. If a good trader places their SL 10 pips under Y and enters at the bullish engulfing at the same Y, would they want a 0.5 : 1 trade, a 1 : 1 trade, or a 2 : 1 trade?
Professionally speaking, traders will only trade when they have at least 1:1, 1:2 or 1:3 calculated from their entry to a nearest logical take profit level like Octo 1 and 2. You can use this information and reverse engineer potential profit taking levels, by projecting the difference in price value. Either way, we don’t really know, but at least, if we see a potential reversal pattern around that range, we will know its best to take what we’ve made, before it gets worse.
After X and through the break of Y you will notice another basic principle of price movement taking place indicated by the !!! (exclamations), the change of polar relativity. Broken R becomes S. One misconception is that when R is broken it turns to S and it MUST hold. NO! The same way any other S or R area can be broken, the same way a fresh polar change can be violated, it does not HAVE to hold so don’t kid yourself. It's all depends on the market interests.
The general rule of thumb is that broken R turns into S which has to be validated by a test. Sure enough I can agree with this, but it doesn’t always happen, price tends to sometimes shoot right on and up without coming back. When however this occurrence happens and the price forms a base around the newly turned S, this corrective area becomes a potential entry point for fresh buyers who were out shopping with the wife and just got back home to have their jaw dropped on the missed trade. They now have a Support area with a solid price base, the more solid the base, the more reliable the S, the more confident you can feel in placing your SL under that point. Imagine the S here being like a shield. You don't know how strong it is, so you need to see how much damage it can sustain. The more candles that build up over it, the stronger you perceive it to be and the more reliable it becomes to use it for protecting your SL in a long.
After the bullish engulfing pattern occurred over !!! (exclamations), buyers all jumped in the hot air balloon's basket and euphorically floated away into the skies. I DO want to beat a dead horse, so I will ask again!! What do smart traders have and do ? They have a SL and they have a target ? – We know where out SL is, where is our target….? Someone say it please…. That’s right! Previous R. Areas at which the price has had problems before and is likely to have them again. The big bully who you know will most likely kick your ass if you walk around his corner in school, he is always there, always waiting… when you get close, you want to RUN. When you buy, you want to sell at the ugly, low self esteem child beater and run for your life with all you have left. The same thing applies here. !!! (exclamations) depicts a change of S to R, this is an area where Sellers, WILL have an interest in entering, because it is a solidified area, over which placing a stop will have a smaller chance of getting hit, a good shield that can withstand even the Klingon Starship's photon torpedos at max charge.
Please note that I do not use words that describe absolute certainty when writing. We are talking about narrowing down possibilities and minimizing risk. Any scenario which can provide us with a minimized risk, is worth taking. You will not find the perfect spot. And even if you do, you’ll only know it is, when it moves your way. Like I like to say, you are always wrong, until you’re right.
So fine, it’s all peachy now and the buyers loose an interest and start taking major profit, more sellers come in, everyone is selling now (so to say). So what do we do yet again? We find the most logical area at which a human being would consider taking profit. Somewhere where you think people are likely to loose an interested in selling, become agitated, become uncertain, panic, get scared, get emotional even get greedy. For us as sellers from point 1, that area would be 1.1 a previous R now turning S. So what what do we see here ? People start buying. Maybe they are scared, maybe a lot of things, nobody really knows, but we understand the possibility of reversal at this point and we take partial profits and perhaps move to B/E… the price corrects, but people still have more lots short left. Yet again even in this minor corrective scenario, you can see the price movement is a victim of cause. Caused by S, and consecutively the take profit target yet another victim of cause a previous S turning R in the likes of point K. Here the buyers from 1.1 meet their logical target, on lower time frames they are no longer interested in buying on dips, even fresh buying won't come in on dips any more and the sellers become ever more interested in selling with a low risk opportunity at hand. Any smart trader who now missed the initial short at 1 has good reason to sell. Fresh sellers come in, driving the price down and putting a smile on the ones who only took partial profits at 1.1.
From point K, you need to ask yourself the same question yet again and find the most logical take profit level. A price area at which interests will change and the scales will gradually tip, people will secure their positions, exit and buyer who were out walking the dog will get the chance to risk their hard earned money with a low risk situation due to the small SL buying at 2. Further up after point 2 the situation is extremely bullish, the most experienced traders (selling short) already exited at 2, the less experienced may still be holding their position thinking that it’s gonna break through and maybe some poor bastards who entered short at L were too optimistic (plain stoopid) and closed at A, wasting both time and money instead of closing at lows of 2.
Smart buyers at 2 have met their first take profit level at A or previous L, people stop buying at this point. The pressure decreases, the buyers are becoming weak and can no longer propel the price to newer highs, nor maintain closes at their session highs. The demand from buyers is being equally met by the supply from sellers. Dojis start occurring, the market is at an equilibrium; point A. The more it ranges, the stronger a ceiling forms, the more attractive placing a stop loss above this safe zone becomes to sellers. Soon enough the selling becomes too much and it tumbles. Support is found around previous Z also about 50% of movement 2.A. New buyers who just got home from the football game now finally see a good buying opportunity, the others who took partial profits at the top are considering reentering, but it would probably be better for them to see confirmation from fresh buyers before adding more risking more money and adding lots, they as us are scared and want to know they have backup, they need a visual confirmation. Sooner than later a bullish engulfing pattern forms adding more confirmation, we have a consolidative break out on lower time frames. Buyers flood in, in respect to the low risk scenario buying at B. The price spikes up with a lot of buying momentum, slight problems are encountered at previous A, where some people start taking profit, but the pressure is too great, it surges on wards failing to produce any reversal signals even around 1, breaking through confidently. At point C, for reasons beyond my understanding people start taking profit. Why ? NO IDEA. Maybe. Someone started taking profit, and it went lower, then someone else took profit on the back of this, and it went even lower, then others took profit and it unwinds, the lower it goes, the more people consider liquidating their positions to save the profit they’ve made. Every good trader is "optimistic" and will be willing to loose a part of their floating profit in the hope of the termination of the correction, but everyone has their breaking point. If I’m up 50, I will tolerate it going down to 25 before closing. I am willing to let the market express its self so I can make an adequate decision, not acting prematurely.
To pinpoint a potential point D I have used a trend line drawn by connecting 2 and B and drawn a fibonacci retracement to predict where it may cease the sell off. This technique requires that the projected trend line approximately intersect with a Fibonacci level, to give you “double support” – This is a technique used by many professional traders who trade with the trend and is very efficient.
So now I come back to the beginning of this explanation. Determining potential reversal points in trending markets. Now that we have point 2, A and B, we have the capability to do several things in order to determine profit taking levels apart from the logical previous High (uptrend). You might be asking yourself why? Why isn’t the previous High good enough. The answer as I stated before is that every market situation the 3 of which we know to be: up, down and sideways constitute their movement and choreography based on simple rules pertaining to the individual situations. In up trends, the expectations are of Higher Highs and Higher Lows, so although we will take into consideration the first logical take profit level (previous H) – we understand that for the successful continuation of this uptrend the price movement must adhere to the basic rules that are foundational contributors to its continuity. In other words, apart from the previous HH, we now have another priority, the variable new HH which comes after the corrective HL.
By drawing a trend line from 2 to B we are able to potentially predict the corrective halt that is D and determine an area where buyers will become more interested than the sellers, what we can’t predict using Consolidation trading psychology is where the Higher High will be after C when corrective movement C.D terminates. To do so I use fibonacci extensions. You need 3 Points, in this case B C D. Drawing a Fibonacci extension through these points similarly to a normal Fibonacci retracement tool using only two points helps provide potential reversal areas, in our case potential Higher Highs, the variable unknown that will come after C. If we draw a trend at the top form A to C, we would be able to create a rising channel and intersect that with a fibonacci extension level and determine a potential Higher High or a level at which sellers will become more interested and buyers will start taking profit. If someone is taking profit somewhere, there is a reason, and you can find it on the chart using the right tools.
My conclusion here, is that I want you to be aware of what is going on around you. To be aware of your trading environment, to know where these “targets” are. The easiest way to do this successfully is to put asking yourself these questions into regular practice. Ask yourself Why and ask yourself Where, so you get your brain thinking out of the box.
Best Regards,
-----------
E. Lang
-----------
My Thread
Hi guys,
Note the chart above. There is a potential trade in play.
I’ve specified the Take profit, stop loss and entry levels.
I’m sure by now you’ve noticed that when the market is ranging and we have defined R and S levels between which traders can open orders and liquidate their positions, things are very easy.
Traders interested in buying, do so at the Bottom of the channel, where there is the most buying pressure and sell at the first logical take profit level which is the channel’s High or Resistance.
The closer it gets to the top, the more interested the buyers become in taking their profit, the less interest they have in buying anymore near the top or adding to their position on dips on lower time frames, at the same time those who missed the entry because their pre-trade risk evaluation does not allow a 1:1 due to the large SL being so far away from the lows now wait for reversal confirmations around the top to start selling with their first take profit target being the bottom of the channel…
If only trading were this easy every time and the market only moved sideways, we’d know where to buy every time and where to sell. We would never loose. Unfortunately things aren’t always so rosy. It is extremely important to keep in mind the fact that as yourself the people on the other side of the deal are also human, with common needs; they need a safe place to enter which will provide minimal risk over their capital via a small stop loss and a good place to exit. What I am trying to emphasize on here is that in order for the price to move, it needs reason, it needs motivation. For someone to do something he/she needs a goal. In the forex market or as far as we are concerned as individual traders and from an enclosed technical view, these goals are R and S levels, areas at which the buying and selling interests change due to logical stimuli.
If the price were to start trending up, don’t just say, the price is trending up. Ask yourself why, say to yourself, if this person was me, and I bought and moved the price, where would I want to exit ? Where would sellers become interested in selling, where would my price most likely start reversing on me? Find these support areas, find these resistance areas. If something moves, it has a goal, find it on the chart.
In a trending market things tend to take another turn. Determining potential reversal areas demands the use and application of varying tools. Since there is no strongly defined area of initial take profit for buyers, like Strong resistance and Strong support for the sellers a different psychology needs to be understood in order to adapt a system to the current situation at hand efficiently.
In order to understand how a trend works, you need to take a look at the underlying anatomy of price movement and introduce yourself to Higher Highs, Lower Lows, Lower Lows, Lower Highs and what constitutes the start and reversal of a trend. I sent you guys some books the other day. One of them by Pring explains the essentials needed to grasp the essence behind these particular price movements. I strongly recommend that you familiarize yourself with this.
In every scenario we have in the market ie, down trend, uptrend or sideways movement a different set of principles are applied in order to take advantage of what is happening. We know that in a channel, sellers will enter shorts near a high where they have small risk and buyers will enter near the low. In an uptrend however, and this applies vice versa to a downtrend, we are unable to rely on the same probability of reversal using the former principles of movement. To determine profit taking levels you need to be able to read a chart well and know when it is showing clear signs of reversal through the use of supplementary tools like candlestick charts and western technicals.
http://img526.imageshack.us/img526/5016/70326559fn2.jpg
In the downtrend to the left you will notice that buying at the lows of X would not have been a problem at the beginning of the trend as we at had a considerably reliable prior area of support to take into consideration when guaging market interests and valuating the probability of a reversal; point Y. As I mentioned before, you need to ask yourself what every responsible trader will; “Where will my stop loss be?”, “Where will I secure my profit?”. Our SL here is placed below there areas Y and X which are lows and represent a price value area at which sellers will not have an interest in selling due to the lack of a professionally sound area to place a stop loss that can be relied on. No one will be selling there, I mean, where would they place their SL !? – in the middle of the movement ? – No way!
The people that cause the penetration of lows and highs in a range vary. They can be economic events and news releases which change the interests of buyers and sellers. At this point taking into mind the prior statement, it is possible that unlike before, more sellers are now interested in selling at the lows, as they have a longer term goal that outweighs that which we are able to perceive as intra-day traders. People who were within the range, now have more “reason” to be continuously aggressive in buying around the highs or selling around the lows, rather than covering their positions, because the expectations have changed and interests outweigh each other causing a dis-balance in the market. When this happens abruptly, stops can be taken out which further more piles up the directional momentum, adding additional fuel to the fire, causing the start of a new trend. Illustratively, buyers at X, maybe initially had plans to take profit at Z, but were encouraged by events or factors inexplicable to us that invited more buyers at the highs of Z and disinterested more sellers from entering causing an overload in bias. Other reasons can be organized sells and buys by banks and large corporations and organizations around the extremities of these price movements. Lurking in the quiet shadows, an organized sell at point X, where small buyers are coming in due to the low risk high probability trade, could dump the price just enough to cause panic, influence closing long positions and possibly even take out stops, in doing so short circuiting the price and the expectations drawn out by human psychology its self.
Their aim is to get enough little fish on the hook to pile up as bait so the hook can perpetually weight itself lower to the SL, where the big shark takes a bite. The more SLs that are hit the more the price will move in the opposing direction of fresh buyers at point X, because when you Buy and set a SL order, for your platform to execute it, it needs to hit Sell to complete the two way transaction between the buyer and the seller. Taking out stops, piles up selling pressure in a buying scenario. At this point the crowd splits into groups. The lows are violated, SLs are possibly taken out. The organized sell that short circuited the SLs does not invest any more into the sells, they wait on psychology to do the beating and allow the combined market fear to fulfill the pseudo-realistic-self-beneficial prophecy on its own. At this point people are panicking, some are selling to liquidate their longs with small losses, others still have hope, and some know exactly what is going on, so they hold their long positions attempting to minimize any contribution to additional selling pressure that may cause even more buyers to unwind.
The psychology behind price movement can become very complicated if you make it, as with everything else in forex, or it can remain very logical as it naturally is. Everyone has a breaking point and despite what I’ve described here, there is no accurate price value for buyers at X to determine when it's best to give up on the long. This is chaos. The only way we can control it is by accepting that we can’t. In doing so we learn to control ourselves instead. We learn to hold our SL, we learn to let our profits run, we understand that the difference between being on top is no longer about winning every time, because you know that it is impossible. It’s just a matter of consistency.
Understanding the little patterns, hints and signs and taking advantage of them allowing statistical probability to carry us to gains at the end of the month. The worst thing you can do is create the illusion of control in this market. Nobody is safe, but by applying very basic logical take profit, buying and selling principles all based on the primal feelings of fear and greed you will succeed.
Now back to the chart. If you bought at Y you would need a target. The same way you need some sort of hold (resistance in a buying scenario) over which to throw a grappling hook and pull yourself to the highs, the same way you need a resistance area or technical number when you’re buying to pull yourself up to successfully and most importantly with a probability of success. With the probability of that being the best place for your grappling hook to lodge itself visually. A decision based on the safety of your life (Fear), primal feelings; "If i hook here, will the rocky and uneven wall allow me to climb up faster than my competitor or slower" (Greed). The decisions we make are a fine balance between these two emotions.
For a good buyer at Y a sensible take profit level would be Octothorpe 1 or 2. Why ? – because it’s the most logical and technically sain thing to do. Now, how do you know if it is going to go to Octo 1 or Octo 2 ? – There is no way you can say, but you can consider the following when doing so. If a good trader places their SL 10 pips under Y and enters at the bullish engulfing at the same Y, would they want a 0.5 : 1 trade, a 1 : 1 trade, or a 2 : 1 trade?
Professionally speaking, traders will only trade when they have at least 1:1, 1:2 or 1:3 calculated from their entry to a nearest logical take profit level like Octo 1 and 2. You can use this information and reverse engineer potential profit taking levels, by projecting the difference in price value. Either way, we don’t really know, but at least, if we see a potential reversal pattern around that range, we will know its best to take what we’ve made, before it gets worse.
After X and through the break of Y you will notice another basic principle of price movement taking place indicated by the !!! (exclamations), the change of polar relativity. Broken R becomes S. One misconception is that when R is broken it turns to S and it MUST hold. NO! The same way any other S or R area can be broken, the same way a fresh polar change can be violated, it does not HAVE to hold so don’t kid yourself. It's all depends on the market interests.
The general rule of thumb is that broken R turns into S which has to be validated by a test. Sure enough I can agree with this, but it doesn’t always happen, price tends to sometimes shoot right on and up without coming back. When however this occurrence happens and the price forms a base around the newly turned S, this corrective area becomes a potential entry point for fresh buyers who were out shopping with the wife and just got back home to have their jaw dropped on the missed trade. They now have a Support area with a solid price base, the more solid the base, the more reliable the S, the more confident you can feel in placing your SL under that point. Imagine the S here being like a shield. You don't know how strong it is, so you need to see how much damage it can sustain. The more candles that build up over it, the stronger you perceive it to be and the more reliable it becomes to use it for protecting your SL in a long.
After the bullish engulfing pattern occurred over !!! (exclamations), buyers all jumped in the hot air balloon's basket and euphorically floated away into the skies. I DO want to beat a dead horse, so I will ask again!! What do smart traders have and do ? They have a SL and they have a target ? – We know where out SL is, where is our target….? Someone say it please…. That’s right! Previous R. Areas at which the price has had problems before and is likely to have them again. The big bully who you know will most likely kick your ass if you walk around his corner in school, he is always there, always waiting… when you get close, you want to RUN. When you buy, you want to sell at the ugly, low self esteem child beater and run for your life with all you have left. The same thing applies here. !!! (exclamations) depicts a change of S to R, this is an area where Sellers, WILL have an interest in entering, because it is a solidified area, over which placing a stop will have a smaller chance of getting hit, a good shield that can withstand even the Klingon Starship's photon torpedos at max charge.
Please note that I do not use words that describe absolute certainty when writing. We are talking about narrowing down possibilities and minimizing risk. Any scenario which can provide us with a minimized risk, is worth taking. You will not find the perfect spot. And even if you do, you’ll only know it is, when it moves your way. Like I like to say, you are always wrong, until you’re right.
So fine, it’s all peachy now and the buyers loose an interest and start taking major profit, more sellers come in, everyone is selling now (so to say). So what do we do yet again? We find the most logical area at which a human being would consider taking profit. Somewhere where you think people are likely to loose an interested in selling, become agitated, become uncertain, panic, get scared, get emotional even get greedy. For us as sellers from point 1, that area would be 1.1 a previous R now turning S. So what what do we see here ? People start buying. Maybe they are scared, maybe a lot of things, nobody really knows, but we understand the possibility of reversal at this point and we take partial profits and perhaps move to B/E… the price corrects, but people still have more lots short left. Yet again even in this minor corrective scenario, you can see the price movement is a victim of cause. Caused by S, and consecutively the take profit target yet another victim of cause a previous S turning R in the likes of point K. Here the buyers from 1.1 meet their logical target, on lower time frames they are no longer interested in buying on dips, even fresh buying won't come in on dips any more and the sellers become ever more interested in selling with a low risk opportunity at hand. Any smart trader who now missed the initial short at 1 has good reason to sell. Fresh sellers come in, driving the price down and putting a smile on the ones who only took partial profits at 1.1.
From point K, you need to ask yourself the same question yet again and find the most logical take profit level. A price area at which interests will change and the scales will gradually tip, people will secure their positions, exit and buyer who were out walking the dog will get the chance to risk their hard earned money with a low risk situation due to the small SL buying at 2. Further up after point 2 the situation is extremely bullish, the most experienced traders (selling short) already exited at 2, the less experienced may still be holding their position thinking that it’s gonna break through and maybe some poor bastards who entered short at L were too optimistic (plain stoopid) and closed at A, wasting both time and money instead of closing at lows of 2.
Smart buyers at 2 have met their first take profit level at A or previous L, people stop buying at this point. The pressure decreases, the buyers are becoming weak and can no longer propel the price to newer highs, nor maintain closes at their session highs. The demand from buyers is being equally met by the supply from sellers. Dojis start occurring, the market is at an equilibrium; point A. The more it ranges, the stronger a ceiling forms, the more attractive placing a stop loss above this safe zone becomes to sellers. Soon enough the selling becomes too much and it tumbles. Support is found around previous Z also about 50% of movement 2.A. New buyers who just got home from the football game now finally see a good buying opportunity, the others who took partial profits at the top are considering reentering, but it would probably be better for them to see confirmation from fresh buyers before adding more risking more money and adding lots, they as us are scared and want to know they have backup, they need a visual confirmation. Sooner than later a bullish engulfing pattern forms adding more confirmation, we have a consolidative break out on lower time frames. Buyers flood in, in respect to the low risk scenario buying at B. The price spikes up with a lot of buying momentum, slight problems are encountered at previous A, where some people start taking profit, but the pressure is too great, it surges on wards failing to produce any reversal signals even around 1, breaking through confidently. At point C, for reasons beyond my understanding people start taking profit. Why ? NO IDEA. Maybe. Someone started taking profit, and it went lower, then someone else took profit on the back of this, and it went even lower, then others took profit and it unwinds, the lower it goes, the more people consider liquidating their positions to save the profit they’ve made. Every good trader is "optimistic" and will be willing to loose a part of their floating profit in the hope of the termination of the correction, but everyone has their breaking point. If I’m up 50, I will tolerate it going down to 25 before closing. I am willing to let the market express its self so I can make an adequate decision, not acting prematurely.
To pinpoint a potential point D I have used a trend line drawn by connecting 2 and B and drawn a fibonacci retracement to predict where it may cease the sell off. This technique requires that the projected trend line approximately intersect with a Fibonacci level, to give you “double support” – This is a technique used by many professional traders who trade with the trend and is very efficient.
So now I come back to the beginning of this explanation. Determining potential reversal points in trending markets. Now that we have point 2, A and B, we have the capability to do several things in order to determine profit taking levels apart from the logical previous High (uptrend). You might be asking yourself why? Why isn’t the previous High good enough. The answer as I stated before is that every market situation the 3 of which we know to be: up, down and sideways constitute their movement and choreography based on simple rules pertaining to the individual situations. In up trends, the expectations are of Higher Highs and Higher Lows, so although we will take into consideration the first logical take profit level (previous H) – we understand that for the successful continuation of this uptrend the price movement must adhere to the basic rules that are foundational contributors to its continuity. In other words, apart from the previous HH, we now have another priority, the variable new HH which comes after the corrective HL.
By drawing a trend line from 2 to B we are able to potentially predict the corrective halt that is D and determine an area where buyers will become more interested than the sellers, what we can’t predict using Consolidation trading psychology is where the Higher High will be after C when corrective movement C.D terminates. To do so I use fibonacci extensions. You need 3 Points, in this case B C D. Drawing a Fibonacci extension through these points similarly to a normal Fibonacci retracement tool using only two points helps provide potential reversal areas, in our case potential Higher Highs, the variable unknown that will come after C. If we draw a trend at the top form A to C, we would be able to create a rising channel and intersect that with a fibonacci extension level and determine a potential Higher High or a level at which sellers will become more interested and buyers will start taking profit. If someone is taking profit somewhere, there is a reason, and you can find it on the chart using the right tools.
My conclusion here, is that I want you to be aware of what is going on around you. To be aware of your trading environment, to know where these “targets” are. The easiest way to do this successfully is to put asking yourself these questions into regular practice. Ask yourself Why and ask yourself Where, so you get your brain thinking out of the box.
Best Regards,
-----------
E. Lang
-----------
My Thread
"One Grows Tall After Walking Through A Forest Of Tall Trees."