|
Joined May 2007
|
Status: 2 steps forward, 1 step back.
|125 Posts
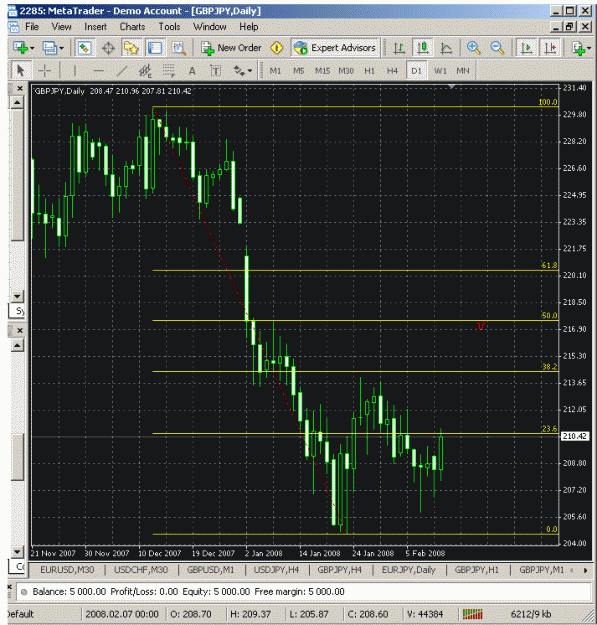
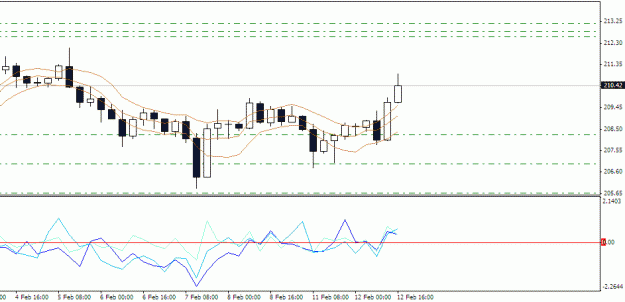
the last 4H bar is way outside the 5sma channel, and the momentum is pointing down, coupled with the 50% retracement , all means that we are heading south for a short while.
Q is this data reliable? I have quite a few pivot line indicators each showing different Pivot line for daily or weekly or so and different S/R levels. I'm actually totally confused.
I use them seldom but I know they are useful when combined with fib levels and very interested to start to use them ... but I don't know which of these data or indicators are reliable. I see every site or every indicator gives different output.
for example the daily R3 is 212.71 in your .pdf file but mine is 212.04 ... they are not even close to each other and so are other S/R levels totally different ...
I'm so confused about these levels and don't know what to do.
Ignored
It's been reliable so far, my broker says they update everyday at 5pm EST. So depending where u live may make the difference, I'm in the US so it will be based on US time. Others could be based on GMT time, etc. . .
I think I am going to wait till DOW closes before entering a short for 50% retrace. This thing is correlating to DOW pip by pip so if any retraces comes it will be after DOW closes and possibley around ASIA session imo
I think I am going to wait till DOW closes before entering a short for 50% retrace. This thing is correlating to DOW pip by pip so if any retraces comes it will be after DOW closes and possibley around ASIA session imo
Ignored
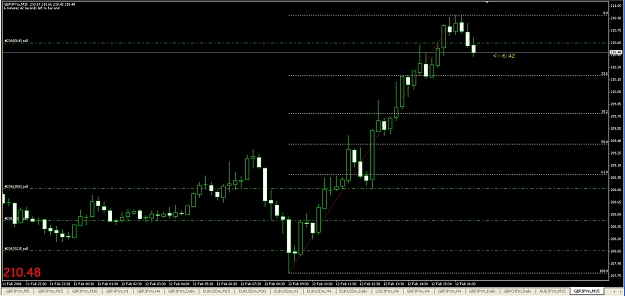
Asia will probably take this pair higher if daily r1 209.90 (now turned support) holds. JMHO. . .
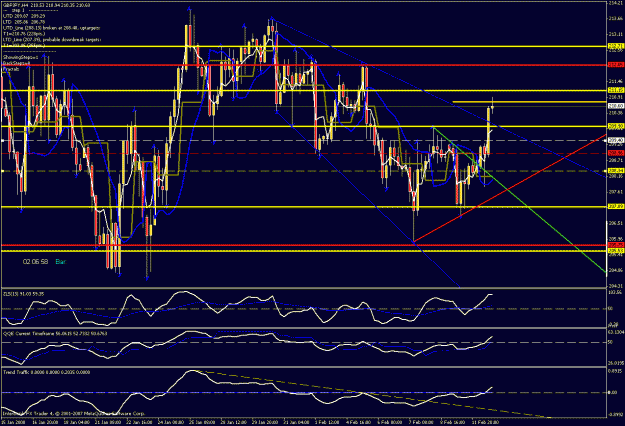
This chart looks bullish to me short-term.
As can be seen it has broken outside the 2 week channel and all indicators are pointing up even TT. Price is also trading above daily and weekly pivots and 4hr hi/lo Gann. . .
Also, notice that once TT is above zero on 4hr chart it continues up until it creates a peaks before reversing - JMHO.
I would wait for a clear signal before going short. At the same time I would be extremely careful with short positions at ths point.
I've read several times here people mentioning that price is below the daily gann etc.. FYI the price being below the gann without the QQE cross it is useless bcz price can easily go back above the gann, i'm just talking from my experience with these indicators. Just felt like mentioning it.. so pay attention to that next time and you'll get what I mean.
Ignored
agree!
Gann fan is NOT a directional indicator, it is a range indicator, where price can walk or fly