|
Joined Aug 2006
|
Status: Terrapin Pipper
|1,186 Posts
Karmo,
Thank you, very much for steering us all to the bigger time frames.
It's been so hard here, dying for simply the whole GBP/JPY to tank, Which it still may!
However,
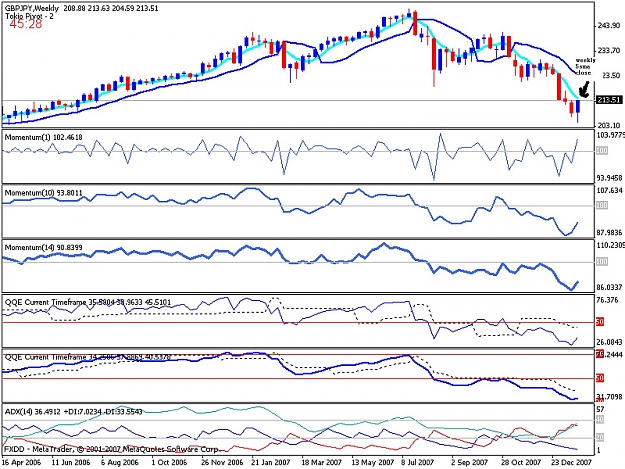
I did your math as well on my simplistic charts, and i got your 217!
With mine it was the Dec 10th Weekly print of a 230.33 high,
on down to the low of 204.62 = 2,571 pips whew! Times that
by 50% and you get 1285.50 basicly 1286 pips. So, adding the
1286 pips to the 204.62 low = 217.48 Whew!
I also,
got your 209 Retrace, from the latest move we've had in a 3hr time frame...
209.63 to be exact. Possibly just a 40% retrace though?
Then there's the bigger goals of the world ending, stock market crashing,
and Yen dying!!! Yikes, but thanks again,
Will trade what's seen, appreciate the help,
Terrapin Pipper,
Jeff P.S. 'Sorry to blabber on w/the math to all the Pro's!
|
Joined Aug 2007
|
Status: Member in Learning
|58 Posts
Whoo!
I've not been here for quite some time now and its good to see that this thread has become alive once again. Welcome back Markam, MB2, Karmo, Vishalj, Pip_chick, Mikew and others for coming back. And for all of u mates who kept the thread alive since last year. Happy new year to all of you guyz. Sooner, i'll start posting my analysis cos a boy will one day become a man.
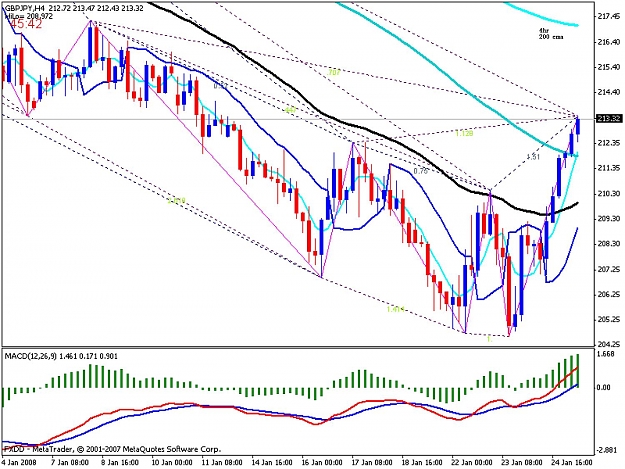
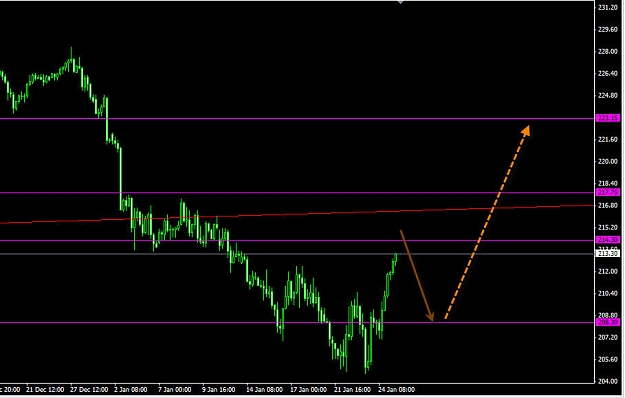
as i said before,if price closed above 4hr 50ema then least will reach to 4hr 100sma.
now price reached that area and breached it.
as see in chart,next target is 4hr 200ema at 217 area,but this target now is so far,and before that there is the weekly 5sma(close) at 214.50 area.and also in that are there is 38.2% fibs line form last bearish run(form 230.30 area to 214.60 are).
so based on this explain we may have this scenario:
price will reach to 214.50 area(that is a strong resistance) and because of QQE5 in 15min,30min and 1hr chart is at oversold are and QQE5 IN 4HR chart is at near oversold area,and because from this upward run,we still didn't see any significant retrace,then price may start a retrace from 214.50 are to 4hr 50ema.
after that we have abounce from 4hr 50ema and price will reach 217 area,where is 50% fibs line of last bearish run.
ps:you must consider the QQE5 AND MOMENTOM 10C action,when price reach to areas i said.
so plz keep in mind,trade what you see not what you think
we might see some profit booked around 214.00maybe that gonna triger tight stop loss and short cover!i dont see much gain from 214.00 as i dont see futher big rally in upside market
we might see some profit booked around 214.00maybe that gonna triger tight stop loss and short cover!i dont see much gain from 214.00 as i dont see futher big rally in upside market
is this the long term outlook as the chart posted on his blog show gbp/jpy going down again.
Ignored
Read YOUR charts, trade what YOU see! When you lose, don't blame AUS. When you win, chalk it up to the system and the rules that you were suppose to follow!
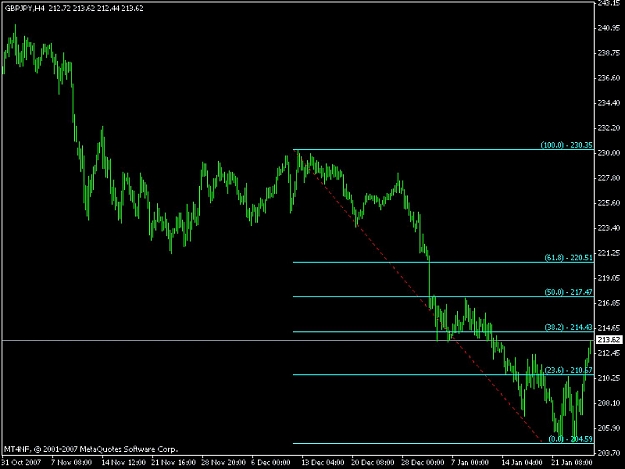
Next Target : 214.30 (%38.2 fib) of 230.30 down to 204.70
If broken ...
Second Target 217.50 (%50 fib) of 230.30 down to 204.70
.... cheers
Ignored
I agree. . .
It may even challenge broken neckline in my opinion. . . This is wave 4 up in a down trend so I'm waiting for it to complete to enter short b/c's trading against the trend is risky. Also, the 5th wave down should end lower, probably under 200.00, we should see wave 5 equal wave 3 down, which was about 2600 pips starting from the drop @ 230.50 to 204.50. . .
as i said before,if price closed above 4hr 50ema then least will reach to 4hr 100sma.
now price reached that area and breached it.
as see in chart,next target is 4hr 200ema at 217 area,but this target now is so far,and before that there is the weekly 5sma(close) at 214.50 area.and also in that are there is 38.2% fibs line form last bearish run(form 230.30 area to 214.60 are).
so based on this explain we may have this scenario:
price will reach to 214.50 area(that is a strong resistance) and because of QQE5 in 15min,30min and 1hr chart is at oversold are and QQE5 IN 4HR chart is at near oversold area,and because from this upward run,we still didn't see any significant retrace,then price may start a retrace from 214.50 are to 4hr 50ema.
after that we have abounce from 4hr 50ema and price will reach 217 area,where is 50% fibs line of last bearish run.
ps:you must consider the QQE5 AND MOMENTOM 10C action,when price reach to areas i said.
so plz keep in mind,trade what you see not what you think
Ignored
shahroodi,
what settings do u use on your mom indicators, open close, high, low etc. . . and can u briefly explain how u use them with qqe5.
There was a report today that there are multiple funds who are buying USD/JPY (when it was at 107.00) today and over the weekend.. looks like that report was true.. this thing is up strong. Unless some crazy news comes out .. the DOW should rally today.
There were a lot of factors that propelled global markets yesterday - the economic stimulus proposed by the Congress, bond insurers getting capital, good MSFT results.. in short, everything was rosy.
Looks like funds want to get back into carry trades.. this will be short lived though. Would be fun to watch GJ go back to 250.. and then duplicate its drop like previous times.
what settings do u use on your mom indicators, open close, high, low etc. . . and can u briefly explain how u use them with qqe5.
Thxs in advance
Ignored
i use momnetom 10 close with qqe5...and use it with aus 1hr/4hr strategy....you can find aus strategy in this link: http://www.pnwenterprises.com/auslanco/
if have any question,i will be glad to answer.
is this a divergence in 4hr chart??
M2 we need your opinion about this
tks in advance
Ignored
Yes, but until the red line crosses down on the blue line on MACD it won't be a confirmed divergence (at least that's how I choose to see confirmation). The histogram is turning bearish but at the very least you want to see the red and blue lines begin to squeeze together as well. right now they are still separated pretty good.
Yes, but until the red line crosses down on the blue line on MACD it won't be a confirmed divergence (at least that's how I choose to see confirmation). The histogram is turning bearish but at the very least you want to see the red and blue lines begin to squeeze together as well. right now they are still separated pretty good.