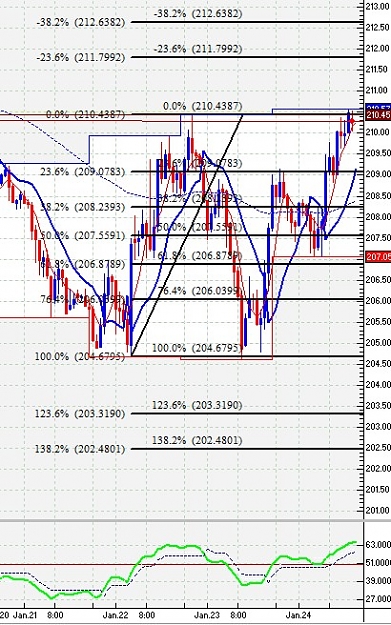
DislikedI have a question regarding the QQE indicator: 30mn ago when I looked at my GY chart, a blue dot appeared under the curve, at 210.30. It came out from nowhere since these dots are supposed to appear when one of the QQE indicators crosses up, and nothing crossed up at this time in the QQEs. It turns out the current price is 210.80 and I could have entered the trade since all the other indicator were bullish (just the QQEs that were upper the 50 level and above the slow QQE for QQE60 for hours now) . But I just figured the dot disappeared: how come?!
What am I supposed to understand from these kind of dots that pop up from "nowhere"?
Does someone know what these dots are, when they are not related with QQEs ?Ignored
- #561
- Jan 24, 2008 1:06pm Jan 24, 2008 1:06pm
- Joined Jul 2007 | Status: Following The Trade Winds | 8,442 Posts
- #562
- Edited 2:22pm Jan 24, 2008 1:09pm | Edited 2:22pm
- Joined Jul 2007 | Status: Following The Trade Winds | 8,442 Posts
- #564
- Jan 24, 2008 1:50pm Jan 24, 2008 1:50pm
- Joined Jul 2007 | Status: Following The Trade Winds | 8,442 Posts
- #565
- Jan 24, 2008 2:08pm Jan 24, 2008 2:08pm
- Joined Jul 2007 | Status: Following The Trade Winds | 8,442 Posts
- #570
- Jan 24, 2008 3:25pm Jan 24, 2008 3:25pm
- Joined Jul 2007 | Status: Following The Trade Winds | 8,442 Posts
- #571
- Jan 24, 2008 3:36pm Jan 24, 2008 3:36pm
- Joined Jul 2007 | Status: Following The Trade Winds | 8,442 Posts
- #573
- Jan 24, 2008 3:43pm Jan 24, 2008 3:43pm
- Joined Jul 2007 | Status: Following The Trade Winds | 8,442 Posts
- #574
- Jan 24, 2008 4:02pm Jan 24, 2008 4:02pm
- Joined Jul 2007 | Status: Following The Trade Winds | 8,442 Posts
- #579
- Jan 24, 2008 6:40pm Jan 24, 2008 6:40pm
- Joined Jul 2007 | Status: Following The Trade Winds | 8,442 Posts