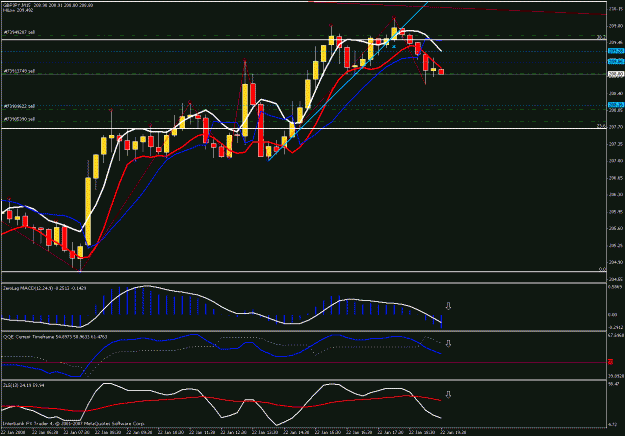
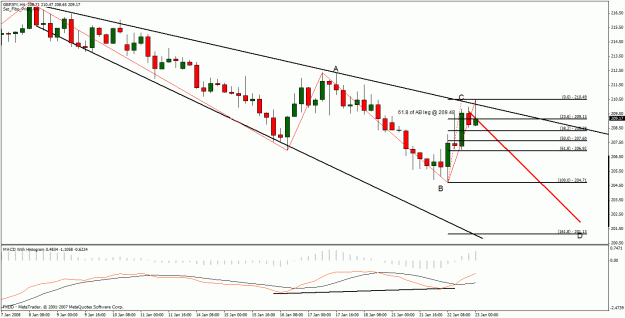
DislikedI'll have more confirmation in a few, but right now based on what I'm seeing in the charts, we have a double top on 4hr @ 212.50 that has proven to be tough resistance and yes weekly pivot comes in @ 209.80's which it was just rejected. . .
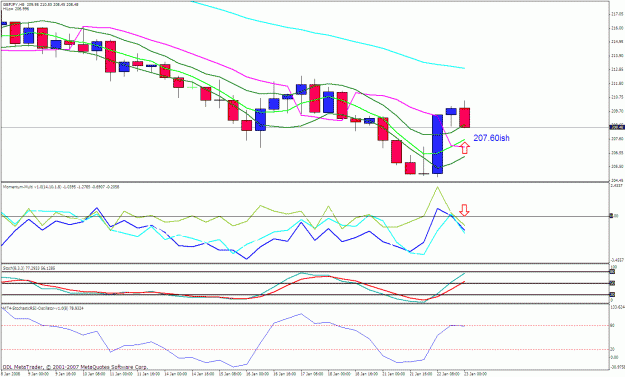
I'm now waiting on a 30 min ZL Stoch to cross over to confirm (early signal for mr) that the downtrend has continued. . . Also, my ZL MACD is starting to roll over on 30 min. A close below 30 gann hi/lo another early signal for me that downtrend has continued. Will post a chart shortly. . .
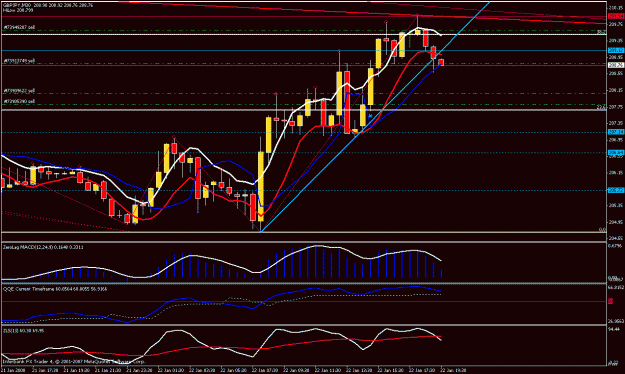
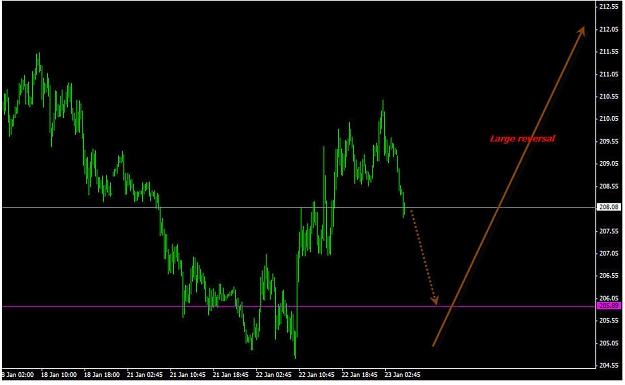
I'm short all over again from 208 all the way up to 209.60
Sell all rallies in a down trend, wait for charts to tell u when its time to buy long term. . . Fundamentally, nothing has changed so. . .Ignored
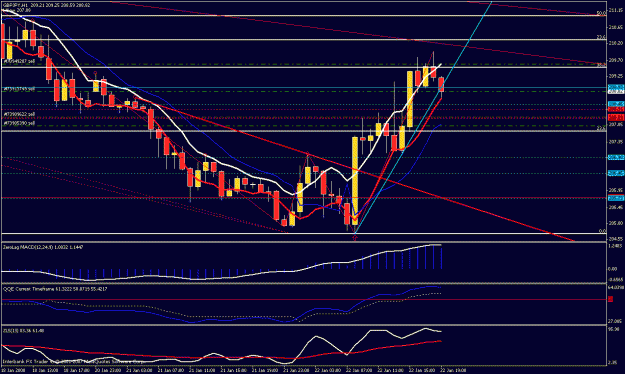
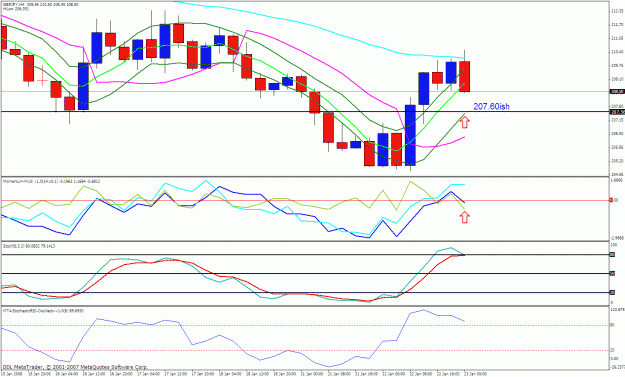
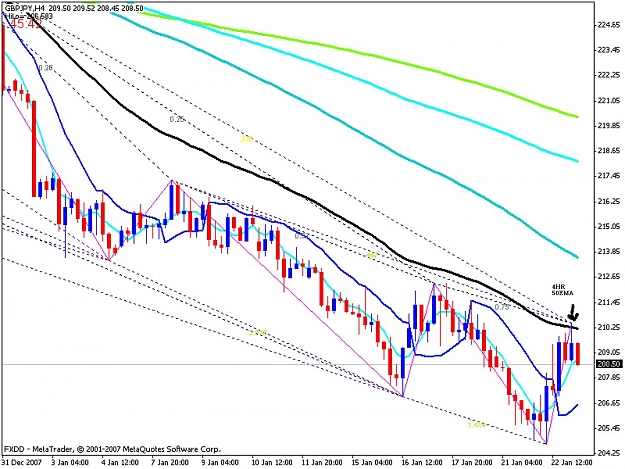
in the way to up gj has significant resisitances at daily 5sma high at 210.90 area and daily gannhilo at 212.80 area.
but one thing we must consider that is the 4hr 50ema at 210.40 area.
if you see the chart in 4hr TF,you see that if price be closed above 4hr 50 ema,then it will reach least to 4hr 100 sma.
4hr 100sma now at 214 area.
so with this explanation i mean we have these scenarios:
1-price maximum reaches to daily 5sma high and then back to down ward.
2-if price be closed above 4hr 50ema,it will reach least to 4hr 100sma area and then back to downward.
3-if price break daily ganhilo and close above that,we have change trend from bearish to bullish.
p.s:it just my 2 cents maybe