There are as many systems available for trading as there are people doing the trading. I'm sure that what I am going to present you here is nothing really new, but if you want an extremely simple way to make quick trades and be successful at it, here you go.
I often trade through the course of the day looking to catch between 10 & 50 pips at a time. Some might call it scalping, others might just call it day trading... be what it may, but the method is accurate and profitable if you follow it rigidly. Statistics wise, I have traded this method 16 times this week and only had to take a loss on it 1 time. That = 93.75% accuracy.
Also, you can follow this system for basically any time frame you want. The larger the time frame, obviously, the longer you will have to wait on returns.
Ok, the details... really simple.
Entry:
On your chart, find your low points and your high points. Plot your trend lines through connecting points starting at major highs or major lows. When the price breaks above or below your trend line, look for a change in direction of the price. At that point, you would go long or short. See chart for example.
Exiting:
One of two ways, either you hit your profit target in which you get out at that level, or when the trend line for your trade is broken and the price begins to go against you. You must exit when the trend you are working is broken. This concept is important when scalping. Because price action can move quickly against you and you can be caught in a direction you don't want to be in. If you get out when the trend changes even if you're at a loss, you reduce your risk and move on to the next trade. It doesn't take long to make a loss up. However, I still recommend you use some form of stop in case you get a power failure/internet loss.
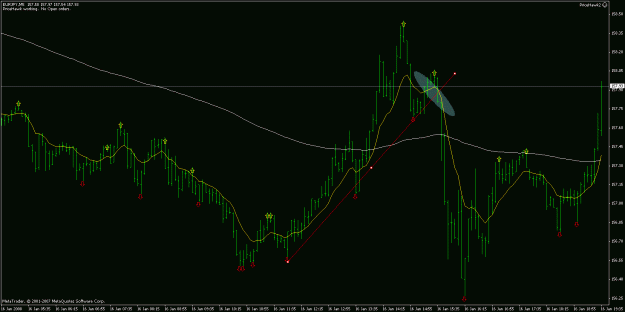
On the attached chart, you will find an example using the Eur/Jpy. The redline represents the trend line. The shaded ellipse shows the trend break and where you enter your trade short at (in this case). Speed is of necessity when making trades because things can go quickly as in this example. Also, I have arrows marking the highs and lows on this chart which make it easy to plot your points through on your trend line. On down trends, just draw your trend through the high points, and of course up trends, the trend is drawn using the low points.
If you follow this method only, I feel you can be fairly successful with your trading. Use common sense and trade in the direction of the market sentiment.
Good luck with all and feel free to send questions.
Marci
aka GirlFlyer
I often trade through the course of the day looking to catch between 10 & 50 pips at a time. Some might call it scalping, others might just call it day trading... be what it may, but the method is accurate and profitable if you follow it rigidly. Statistics wise, I have traded this method 16 times this week and only had to take a loss on it 1 time. That = 93.75% accuracy.
Also, you can follow this system for basically any time frame you want. The larger the time frame, obviously, the longer you will have to wait on returns.
Ok, the details... really simple.
Entry:
On your chart, find your low points and your high points. Plot your trend lines through connecting points starting at major highs or major lows. When the price breaks above or below your trend line, look for a change in direction of the price. At that point, you would go long or short. See chart for example.
Exiting:
One of two ways, either you hit your profit target in which you get out at that level, or when the trend line for your trade is broken and the price begins to go against you. You must exit when the trend you are working is broken. This concept is important when scalping. Because price action can move quickly against you and you can be caught in a direction you don't want to be in. If you get out when the trend changes even if you're at a loss, you reduce your risk and move on to the next trade. It doesn't take long to make a loss up. However, I still recommend you use some form of stop in case you get a power failure/internet loss.
On the attached chart, you will find an example using the Eur/Jpy. The redline represents the trend line. The shaded ellipse shows the trend break and where you enter your trade short at (in this case). Speed is of necessity when making trades because things can go quickly as in this example. Also, I have arrows marking the highs and lows on this chart which make it easy to plot your points through on your trend line. On down trends, just draw your trend through the high points, and of course up trends, the trend is drawn using the low points.
If you follow this method only, I feel you can be fairly successful with your trading. Use common sense and trade in the direction of the market sentiment.
Good luck with all and feel free to send questions.
Marci
aka GirlFlyer
Attached Image (click to enlarge)