He also said that by this time next year our skin would be falling off from radiation sickness in a nuclear winter following the collapse of civilization. 210 I can deal with, but let's hope that's where the accuracy of his predictions end.
He also said that by this time next year our skin would be falling off from radiation sickness in a nuclear winter following the collapse of civilization. 210 I can deal with, but let's hope that's where the accuracy of his predictions end.
Ignored
lmao,,.....wow, im actually starting to get worried....lets hope he's wrong on that one
This market will do that to you. Good suggestion: I'll take a quarter pounder, fries and a drink to go... then go do a purge to prepare for next week. lol
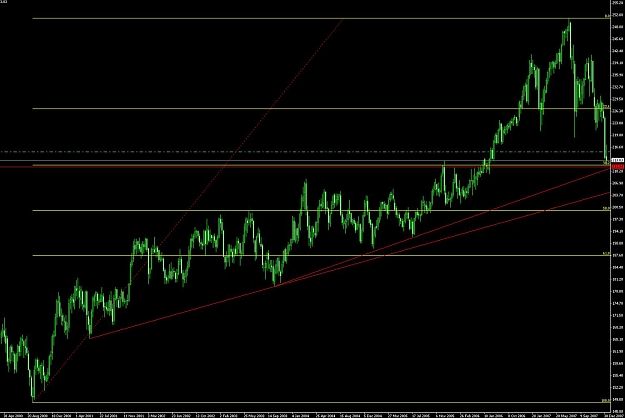
Actually, the weekly and monthly chart does make you pounder. . .
Ignored
yeah i saw that weekly chart with the 38% fibo and flipped over to mine to take a peak and there it was, so we definitely could get a small bounce but with all the neg banking news set to come out monday it may not, but from past exp. the drop we saw today may have been that news so we may have already seen Monday's banking news. something else to ponder i guess. glad we just trade the charts and what we see.
yeah i saw that weekly chart with the 38% fibo and flipped over to mine to take a peak and there it was, so we definitely could get a small bounce but with all the neg banking news set to come out monday it may not, but from past exp. the drop we saw today may have been that news so we may have already seen Monday's banking news. something else to ponder i guess. glad we just trade the charts and what we see.
Ignored
Yep, we trade what we see. . .
Right now I see price hovering above 4hr 5 SMA, a close above here could be positive for longs. . .
Today's daily pivot and s1/r1 is as follows: 213.31 (s1), 214.64 (pivot), 215.79 (r1), these are major s/r IMO, therefore if price sits or is rejected at any of these level that should give clues where price is headed next. It has to either go to the next resistance or support level right? Daily pivots can be used if you are a longer term trader. . .
However if you want to get a better view what price might be doing in between time you can key in on 4hr pivots which I talk about alot. . .
Here is an example of what GJ price is doing right now and you can expect it to hit these level once you determine which way price it headed. . .
Just to give you an example of how I used them today. . .
Price tanked to 211.98 which hit s3, so I new that was the bottom for the moment so I scaled out of my short from 215.05 and flip it long. Manage to get in @ 212.40 long for the ride up to at least 214/214.48. . . It hit 214 so far, that's why I said a close above 213.57 would get it up to the next r2 @ 214 and possibly 214.48 and daily pivot of 214.68. . .
Now price has gone back below 213.00 therefore acording to the 4hr pivot gj could go as low as 212.66 or back to test the lows where I would get long and do it all over again if it bounced. . .
Ignored
Price hit 211.98 at 02:00 EST, 214.00 at 11:00, then down below 213.00 after 13:00. Why are you still referencing the same set of 4hr pivots. Shouldn't you be using the most current set?
yeah i saw that weekly chart with the 38% fibo and flipped over to mine to take a peak and there it was, so we definitely could get a small bounce but with all the neg banking news set to come out monday it may not, but from past exp. the drop we saw today may have been that news so we may have already seen Monday's banking news. something else to ponder i guess. glad we just trade the charts and what we see.
weekly bullish bat with a range of 1100 pips from top of box to bottom. LOL. someone test this and let me know the results. i am going long in my demo just to see what happens
Ignored
Don't forget the bottom target is sitting as low as 204-ish