I ve got metatrader up and running and have never used indicators like Fibonacci to determine which way the market moves
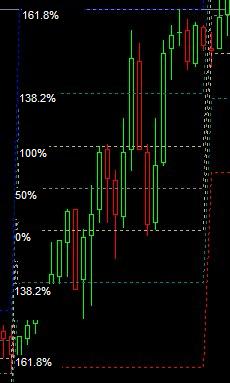
I m willing to give it a try so can someone please explain how to get the 50% Fibonacci line up? And secondly what it means and how to interpret it
I use Volumes / Moving averages and charts top determine daily trading patterns but I m keen to try other alternatives and lear from others.
Does anyone know?
Thanks