I am going to go against the grain here and look for a move down as we begin the New Year. Looking at the daily chart we have failed to establish any new highs for over 3 weeks and it looks as if we are stair stepping slightly downward. Using history as a guide, unless we are going to break entirely new ground, we must start a Bear movement. The Bull is tired.
I tried to reproduce the problem you have with I-LRC AHA 0_2 but couldn't. I guess you have some other indicators running on the same chart and tends to delete all the objects when switching timeframe or charts.
The latest version is 0_3 btw.
IMHO, indicators are just tools, it's advised to draw those channels by hand if you are still learning the SRDC II. For me, I use I-LRC to save my time, and when it doesn't make sense I will quickly draw LRC manually. And also it's advisable to draw multiple channels just to keep an eye on the new development of new trends.
To study the way of channel drawing, read henry's manual on accrete's website. Or read his post here in this thread (you may find the post # in Glenn 's signature, )
Don't want to confuse this topic but feel it's important to share, I have found a couple of jedis in TS has the same understanding as me that: channels provide coordinates to guide our trading (a bit like vegas tunnel funtion wise imho, but totally different coordination system (galactical here? just joking )), the real trigger is your own understanding of price action and other SUPPORT/RESISTANCE (what 's the name of this method again? ). The channel/quadrant lines are calculated mathmetically and isn't necessarily the SR themself (though sometimes they happens to overlap with major SR), that's why you can use different channels (LRC, SHI, STD, etc.) to obtain similar results. In that sense, the channel doesn't have to be 100% accurate, as long as you are on the right direction.
Back to the indicator, I am sure there are still bugs in I-LRC AHA 0_3 and the trend detection logic isn't perfect too. I just don't have the time to improve it right now. So though it's still a useful tool (at least for me), I wouldn't rely on it. Also I would suggest to try Lou G's indicator (downable from accrete's site too) and see if it suits your style better.
aha
Quoting AltosTrader
Disliked
Hi Aha - I have been using your I-LRC-AHA-02 and occassionaly overlay MT4 LRC as a check. What puzzles me is why there is still a lot of talk about how channels should be drawn but I have not noticed that yours as above have been "dis-approved". Can you enlighten me as to the "officially correct" channel parameters ?
I seem to have a graphics problem with MT4 in that drawn objects disappear when I change to say, EUR and come back to GBP, any self drawn lines are gone but the I-LRC-AHA stays for me. Is there something in I-LRC-AHA that is not correct in the group view ? If so, what.
I am in Australia and so correct parameters are even more vital to me as mostly I will place a trade and then often have to go to bed - I have other business interests also so cannot watch a screen all night - must sleep - must sleep - sleep . . . . . . .
Altos.
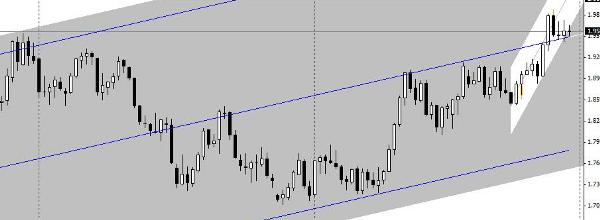
Blue line is median of the 10 June 2001 longer term weekly chart. BIG Boys look long term. Retail Traders look short term. Price action is having difficulty dropping below this line for 1 month. White Channel (11 October 2006) is the channel I believe we are about to resume up. The grey channel is the December month to date bearish channel that we have had trouble dropping below the median since 20 December. BUT, in Feb 1991 and Aug 1992 price had resistance at 2.0050 & 2.0100 respectively.
ORANGE ROSHAN several of us have weighed in now. Would you please give your prediction also. Thank you in advance.
Looking at Tragapips chart it looks like we have a head and shoulders that formed over the month of December. If the price can break resistance at 9715 I think we'll continue up at a good quip. If it bounces off of the 9715 level I would look for a grumpy bear for the month of January at least.
Cheers,
jeff
Quoting Tragapips
Disliked
This my analysis:
December began with a change in cable tendency making its first low Dic 11 at 1.9464. that´s a 38.2 retracement from previous leg.
The next price movemments are not normal for a down trend:
- Rebound again on the 38.2 level...
- Followed by a strong bullish candle (that´s the key for me)
- Price fail to do a lower high on Dic 20 ( requisite in a stong downtrend).
- Price is unable to go below the downtrend median and..
- Price is unable to go below the uptrend median.
So having all this is in mind the probabilities for an up breakout are high.
I am going to go against the grain here ..........
Disclaimer: This all means nothing if I am wrong.
Ignored
By the Way, notice how Bill said here he was going against the grain. Bill and I both caught ourselves using the "I disagree" phrase this week just to show (prove) our viewpoint. I think its important to do as Bill did here. When we have different viewpoints to call it that: going against the grain; different viewpoint; etc. vs. I disagree. This keeps things polite and fun. I trust Bill's viewpoint also and you had better believe I will be trying to figure out how he is seeing the channel as a possible bear waking from hibernation. The good news is we now have differing options in our brain. So if price action goes against the action you were expecting then we must have other SRDC II experts to look to. More pips for all.
Along this line, yesterday in TS I was scalping in between SRDC entries and a having difficulty even though I made pips scalping also. On the other hand Jest was announcing his scalps and was cleaning up. So he had a better handle on the price action and we all picked up on some good pointers from him.
Looking at Tragapips chart it looks like we have a head and shoulders that formed over the month of December. If the price can break resistance at 9715 I think we'll continue up at a good quip. If it bounces off of the 9715 level I would look for a grumpy bear for the month of January at least.
Cheers,
jeff
Ignored
Using the data Orange asked us to use, look at the month of December. Severl candles down, then up, several candles down, then back up. Now look. I think the pattern is true and the last bull candle was just a smaller one. I love a good, honest, respectful debate. All my respect to opposing viewpoints as stated by cbrock.
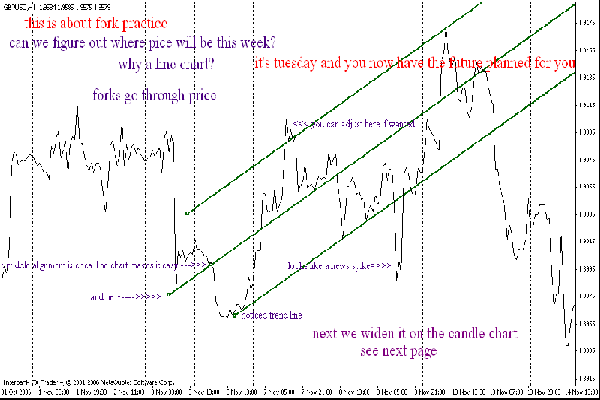
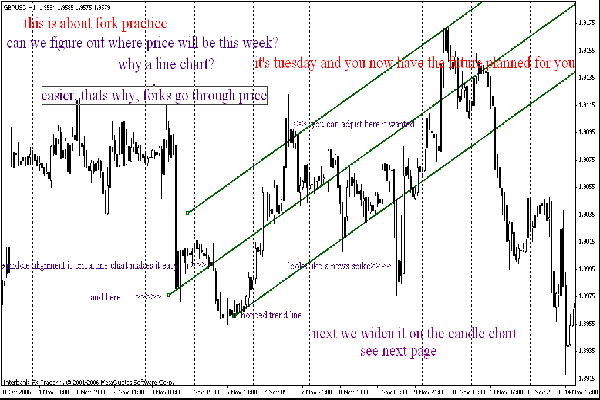
Alright, you guys are probably going to kick me off for this post ( or should I say mini series?), but after a brief frustration period with the LRC, where to draw it from, why is price blowing out of it, and with everyone having there own way of drawing channels with fibs, equest and the infamous ORC, I decided to do some home work on my own. This is surely the most confusing part for all of us. That pitchfork thing that has been sitting in my tools, may have just become my favorite of all. To be honest, I didn't know what to do with it until today. OR, please don't fine me too heavily for the line chart. I will post the candles too. I really need the jedi pips badly...
On with the show...
Pitchfork one: note the three points, that make up the fork were finalized by mid-day monday.
Easy to find points on line chart
I agree with cbrock on this one. Look at the strength of those bullish bars. It appears to me that big boys wants to push the price down in Dec and really big boys wants to push the price up. When news favors to sell $ we see boys agree with each other and we get a long bullish bar. But at the times when news favors to buy $ we did not see the strength in bears as we saw in bulls. And since the median of the bullish channel (in OR's chart) was repected in the end of Dec, we can see big boys (bears) are divided, more big boys begin to wait or even agree with really big boys. So yes, it's pivot point and my bias is up too.
But this is not a suggestion of buy, for small fishes like us it's probably wise to keep that in mind and "float like a butterfly, sting like a bee".
Quoting cbrock5000
Disliked
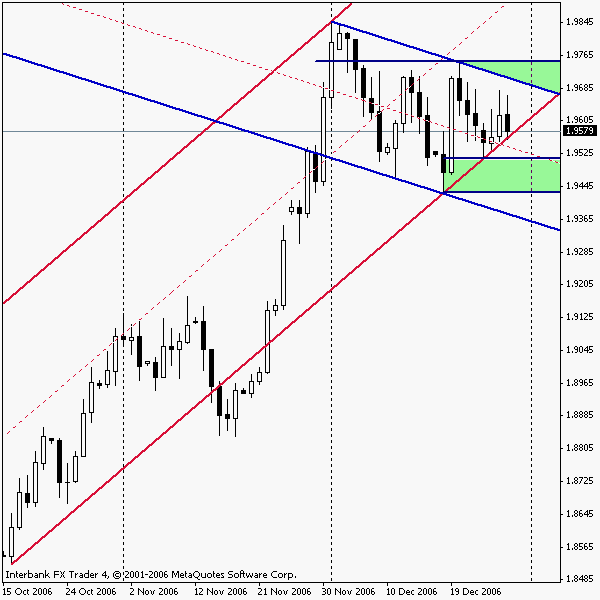
My Bias is we are going up. Weekly partial chart 2 shows we are in a uptrend since 10 June 2001. Note the weekly LRC channel with the Std Dev channel inside. [(Remember - Std. Dev is the predictive price action based upon bell curve distance away from the center line and always a tighter fit. Whereas LRC is the least squares fit of N data points with a best fit center line)]. See chart 1 below with a different view. Notice the TL's are from previous months bottom point through the 6th candle to gain a future trend. August, October & November all three pointed to a cyclical high at the beginning of December. This is not a coincidence. They still point up. We are having difficulty dropping below the current shorter term Oct 11th bullish trend. Unless price action is less volatile next week (which is a possibility while the big boys figure out the game) we will see a test of the shorter term December bearish channel before resuming the uptrend. Also the Really Big Boys (governments) are beginning to sell more $$$ in favor of the Euro (UAE announced this week also). If dollar is being sold which way will the pound go. If more US migrant workers are selling the $$ to convert to curency to send money home, which way will the $$ go.
Check out my attached chart. Looking at the weekly channel, Dec was a retracement and on the move up to Q1. My take is uptrend. (Yoda's sabre is point up too )
I will go against grain meaninglessly to you cbrock (did I use it right?) on your comment on jest's trade yesterday: all the trades are scalps, and all the trades are measuring SR in a daily range (hence SRDC trades, haha).
Yeah, I am looking forward to discuss with jest (and all of you) on SRs/TLs on a daily basis. Let's make the spaghetti right.
Quoting cbrock5000
Disliked
By the Way, notice how Bill said here he was going against the grain. Bill and I both caught ourselves using the "I disagree" phrase this week just to show (prove) our viewpoint. I think its important to do as Bill did here. When we have different viewpoints to call it that: going against the grain; different viewpoint; etc. vs. I disagree. This keeps things polite and fun. I trust Bill's viewpoint also and you had better believe I will be trying to figure out how he is seeing the channel as a possible bear waking from hibernation. The good news is we now have differing options in our brain. So if price action goes against the action you were expecting then we must have other SRDC II experts to look to. More pips for all.
Along this line, yesterday in TS I was scalping in between SRDC entries and a having difficulty even though I made pips scalping also. On the other hand Jest was announcing his scalps and was cleaning up. So he had a better handle on the price action and we all picked up on some good pointers from him.
The alignment on this fork was done with the upper TL that established early and the low, easily distiguished middle point. The third point ( the one that is not isn't on price) was used only to align the upper tl. Channel held the entire week, and was established early Monday. Try dragging the LRC along the week if you try this.
Did you shrinked your charts to make them 600x600? another way of doing this is to right click on your chart and choose save as pictures, then on the pop up window choose the third item and change the pixels to 600x600. I am assumming you are using MT4 here.
By the Way, notice how Bill said here he was going against the grain...
...I trust Bill's viewpoint also and you had better believe I will be trying to figure out how he is seeing the channel as a possible bear waking from hibernation...
Ignored
Yes i'm all for the "going against the grain"... see my little fishy swimming upstream as all the others are going with the "flow" in my siggy ?
Anywhooo, One other point that i'd like to share that CB got me thinking upon. A FX mentor of mine always includes this concept: look for as many reasons as you can to stay out of a trade.
This mindset, combined with looking/studying other's reasons for why they are going into a trade might just whack you upside the head and the light bulb go on for the ideal trade setup. ! ?
Joined Sep 2006
|
Status: Chasing Trends
|2,339 Posts
Aha,
The post is one of the best i've ever read...
Quoting aha
Disliked
AltosTrader,
I tried to reproduce the problem you have with I-LRC AHA 0_2 but couldn't. I guess you have some other indicators running on the same chart and tends to delete all the objects when switching timeframe or charts.
The latest version is 0_3 btw.
IMHO, indicators are just tools, it's advised to draw those channels by hand if you are still learning the SRDC II. For me, I use I-LRC to save my time, and when it doesn't make sense I will quickly draw LRC manually. And also it's advisable to draw multiple channels just to keep an eye on the new development of new trends.
To study the way of channel drawing, read henry's manual on accrete's website. Or read his post here in this thread (you may find the post # in Glenn 's signature, )
Don't want to confuse this topic but feel it's important to share, I have found a couple of jedis in TS has the same understanding as me that: channels provide coordinates to guide our trading (a bit like vegas tunnel funtion wise imho, but totally different coordination system (galactical here? just joking )), the real trigger is your own understanding of price action and other SUPPORT/RESISTANCE (what 's the name of this method again? ). The channel/quadrant lines are calculated mathmetically and isn't necessarily the SR themself (though sometimes they happens to overlap with major SR), that's why you can use different channels (LRC, SHI, STD, etc.) to obtain similar results. In that sense, the channel doesn't have to be 100% accurate, as long as you are on the right direction.
Back to the indicator, I am sure there are still bugs in I-LRC AHA 0_3 and the trend detection logic isn't perfect too. I just don't have the time to improve it right now. So though it's still a useful tool (at least for me), I wouldn't rely on it. Also I would suggest to try Lou G's indicator (downable from accrete's site too) and see if it suits your style better.
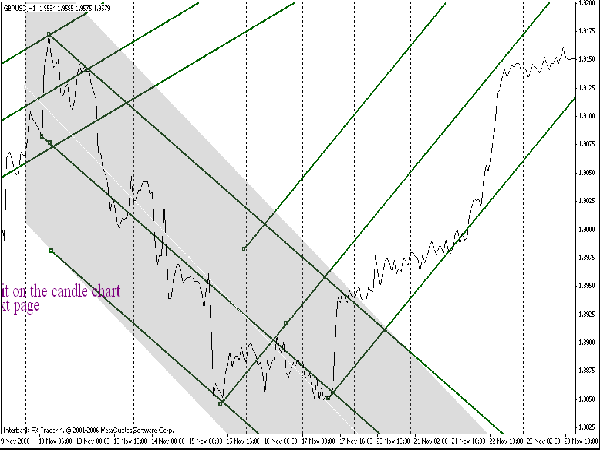
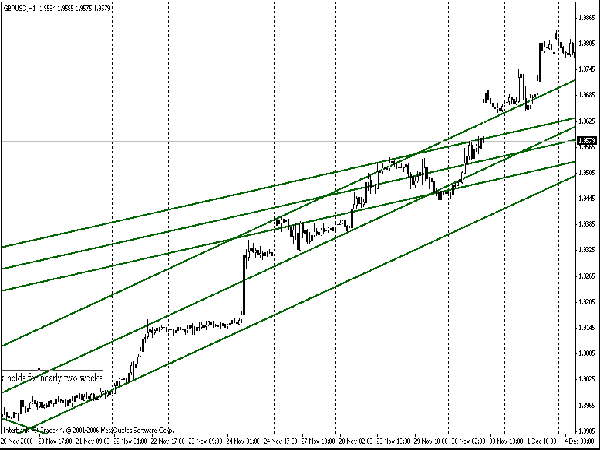
This is the continuation of the previous fork. The channel which was determined in two daysand lasted for nearly two weeks. Is this valuable? Basically, once a fork (or channel) breaks, a new one is created. The trick, is getting the points lined up, which from my brief study here today is:
The middle point, up or down, #1 on the fork. This will make your median
the outside edge, #2
and then 3 is used to either line up the middle with the next up point, if there is no outside TL, or used to line up the two outside points you would typically draw a trendline on. The line charts make it much clearer to find the basic pattern.
I'm not trying to reinvent the wheel here, just thought I would share something that made me very excited, when I noticed the impact it had.
Very crystal ball like.
Please don't fine me master Jedi
Joined Sep 2006
|
Status: Chasing Trends
|2,339 Posts
Quoting cbrock5000
Disliked
Along this line, yesterday in TS I was scalping in between SRDC entries and a having difficulty even though I made pips scalping also. On the other hand Jest was announcing his scalps and was cleaning up. So he had a better handle on the price action and we all picked up on some good pointers from him.
Ignored
Support Resistance, small channel, small pips...there's always a tactic for playing box breakouts and a tactic for playing SR bounces...
The weekly candle does look pretty weak aint it Bill. hmmmm something to ponder