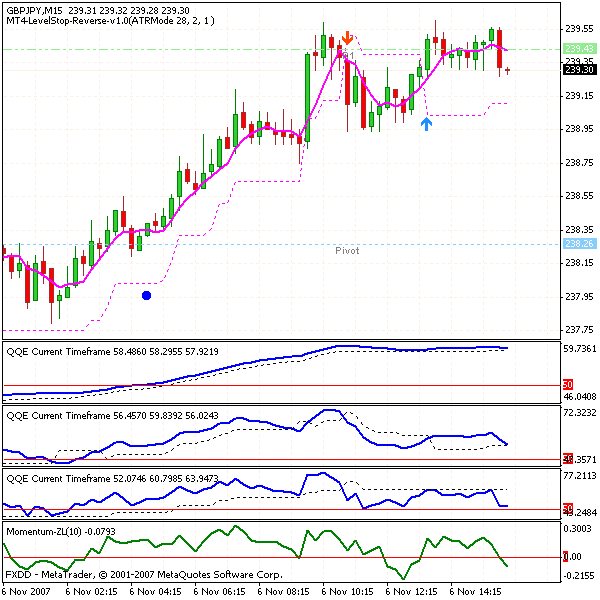
DislikedThe dots are the easiest to explain. They show up when the QQE60 lines "cross over" in a new direction.
The arrow is a little more difficult to explain. But there's a dashed line on my VT Charts called "Trailing Stop Level". This line acts as some sort of boundry line, and when price crosses over it an up arrow or a down arrow appears. If price retraces from that level before the candle closes, the arrow disappears. But if the candle closes while price is over that level, the arrow stays on the chart. You might be able to find this "trailing stop level" line on your MT4 chart, and then you'll probably understand better what's going on.Ignored
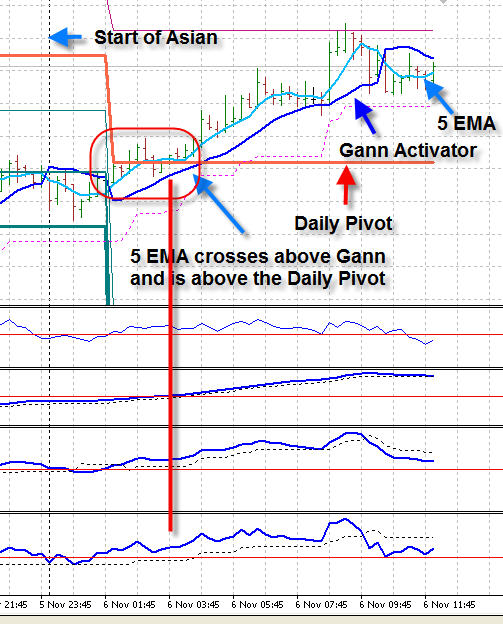
 Auslanco 15min GBP/JPY startegy
- #362
- Nov 5, 2007 10:52pm Nov 5, 2007 10:52pm
- Joined Jul 2007 | Status: Following The Trade Winds | 8,442 Posts
- #363
- Nov 5, 2007 11:14pm Nov 5, 2007 11:14pm
- Joined Jul 2007 | Status: Following The Trade Winds | 8,442 Posts
- #365
- Nov 5, 2007 11:53pm Nov 5, 2007 11:53pm
- Joined Jul 2007 | Status: Following The Trade Winds | 8,442 Posts
- #366
- Nov 5, 2007 11:59pm Nov 5, 2007 11:59pm
- Joined Jul 2007 | Status: Following The Trade Winds | 8,442 Posts
- #368
- Nov 6, 2007 1:14am Nov 6, 2007 1:14am
- Joined Jul 2007 | Status: Following The Trade Winds | 8,442 Posts
- #370
- Nov 6, 2007 1:35am Nov 6, 2007 1:35am
- Joined Jul 2007 | Status: Following The Trade Winds | 8,442 Posts
- #371
- Edited 3:08am Nov 6, 2007 1:39am | Edited 3:08am
- Joined Jul 2007 | Status: Following The Trade Winds | 8,442 Posts
- #373
- Nov 6, 2007 5:59am Nov 6, 2007 5:59am
- Joined Jun 2007 | Status: Be yourself, everyone else is taken | 2,734 Posts

- #375
- Nov 6, 2007 7:59am Nov 6, 2007 7:59am
- Joined Jun 2007 | Status: Be yourself, everyone else is taken | 2,734 Posts
- #377
- Nov 6, 2007 8:17am Nov 6, 2007 8:17am
- Joined Jun 2007 | Status: Be yourself, everyone else is taken | 2,734 Posts
- #379
- Nov 6, 2007 8:20am Nov 6, 2007 8:20am
- Joined Jun 2007 | Status: Be yourself, everyone else is taken | 2,734 Posts