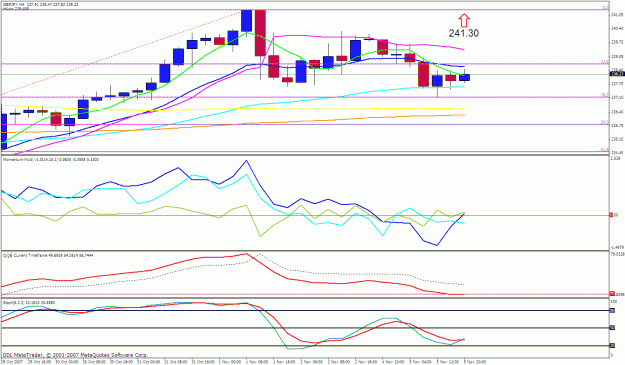
Here is what I am seeing on the current 4H chart. (Please check out the Daily chart showing divergence a few posts above this one). The weekly momentum showing a bit of bullishness (10C), the monthly, weekly and daily showing bearish divergence (MACD to price), and now the 4H Stochastics just beginning to cross and turn up from the oversold line. Me thinks we are ultimately heading down, but before then we could see some consolidation (wood chopping ), which could send price up within the next few days (maybe until the 4H Stochastics becomes overbought?). GBP/JPY likes to retest solid support and resistance areas. I think it could go back up and at least touch the 241.30 area within the next couple of days before the rest of the bearish confluences tear it down. Then again, I've been early on a lot of my longer-term analysis over the past few weeks. Some are saying that the big fall might not begin for another couple of weeks. We know from past experience that this beast can grind away in a nice range and still remain tradeable. So keep your eyes on some of the things mentioned in some of these recent posts and pick your entry points carefully.
M2B
M2B
Attached Image (click to enlarge)