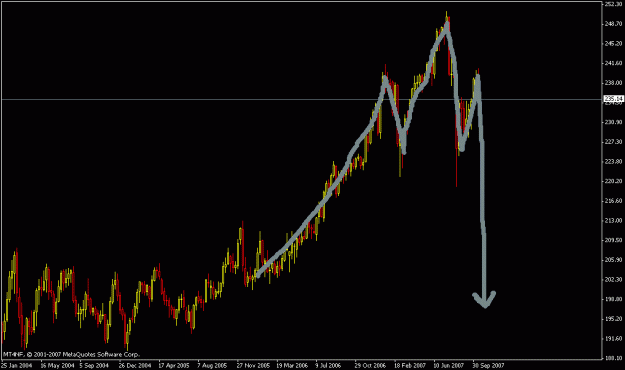
There is a perfect head & shoulders in GBPJPY weekly chart as shown in figure.
The last two times this year in daily chart we had a similer pattern and the market fell 2000 PIPS in Jan-Feb and late July-August period.
And this time we are seeing the same pattern in "weekly" chart.
I had posted earlier about the pattern in main GBPJPY thread and since then, the right shoulder is half way and 500 PIPS down.
Is next week going to be another big crash...Dow is showing all signs of it today already..
Will coming week be one of our most important days in our life's..
There are numerous signs of it...I just got hold of one...
Do you guys see more signs like this....
Good Luck
