Prepare yourself for the southward journey the market is going down all the way down..
Perfect head & shoulders in weekly chart,,,,,,yeah i spelled correctly its weekly chart...that would mean a easy 3000 to 4000 pips drop..
You are right this time people...think objectively..we are not special or unique...its all objectivity at play...the market has nothing against us ...the pips will come down to us eventually...
Now the question is not when you will get the PIPS but how will you spend it...im thinking of thailand and then a round trip to spain and brazill, finally halting at russia...where chicks are more cooler
Good Luck to you all..i wil repost in other gj thread just to control my euphoria
How can it be a perfect head and shoulders when the right should has not even fully formed? The perfect H&S will also need to break the NL and I have my doubts it will.
Ignored
The weekly chart shows a nice h&s formation. What am I missing here?
Perhaps you could point out what is deficient with the NL.
How can it be a perfect head and shoulders when the right should has not even fully formed? The perfect H&S will also need to break the NL and I have my doubts it will.
Ignored
finally, we have a master to point such frequent mistakes, i've been always doubted the way of such referring to H&S. Now I'm sure it's wrong, hehe.
The weekly chart shows a nice h&s formation. What am I missing here?
Perhaps you could point out what is deficient with the NL.
Ignored
The Neckline on Head and Shoulders isn't drawn across the top of the shoulders. It is drawn at the bottom of the end of the first shoulder and the bottom of the beginning of the second shoulder. Until the far side of the right shoulder comes down and closes beneath the neckline, which right now is around 218.50 and descending, then you can't technically call it a true H & S. The reason Zoran is saying that it's not gonna' happen is because this is a Weekly Chart, and by the time the H & S completed, price would be way below 200 (probably), and the date would probably be March or April of 2008 before a legitimate move was official anyway.
Prepare yourself for the southward journey the market is going down all the way down..
Perfect head & shoulders in weekly chart,,,,,,yeah i spelled correctly its weekly chart...that would mean a easy 3000 to 4000 pips drop..
You are right this time people...think objectively..we are not special or unique...its all objectivity at play...the market has nothing against us ...the pips will come down to us eventually...
Now the question is not when you will get the PIPS but how will you spend it...im thinking of thailand and then a round trip to spain and brazill, finally halting at russia...where chicks are more cooler
Good Luck to you all..i wil repost in other gj thread just to control my euphoria
Ignored
As posted in the other thread.......
"I suggest that you put your bong away and take a second look at your charts......whilst the potential for a H & S is there, so far price is still above its 4hr 200ema, which is still rising. IMO you need a much larger fall before your suggestion becomes reality"
IF this weeks candle can close under 234.74 thus being a bearish engulfing candle in realation to the week before last then we will be starting to show some decent signs of a move down.
The Neckline on Head and Shoulders isn't drawn across the top of the shoulders. It is drawn at the bottom of the end of the first shoulder and the bottom of the beginning of the second shoulder.
M2B
Ignored
Selling into the rt shoulder is usually a good risk : reward ratio while anticipating a NL break. ALways be ready to take profits should the price bounce off of the NL
The Neckline on Head and Shoulders isn't drawn across the top of the shoulders. It is drawn at the bottom of the end of the first shoulder and the bottom of the beginning of the second shoulder. Until the far side of the right shoulder comes down and closes beneath the neckline, which right now is around 218.50 and descending, then you can't technically call it a true H & S. The reason Zoran is saying that it's not gonna' happen is because this is a Weekly Chart, and by the time the H & S completed price would be way below 200 (probably), and the date would probably be March or April of 2008 before a legitimate move was official anyway.
M2B
Ignored
Well there, I'm learnin'.... and I imagine so have a few others from your instructions.
"I suggest that you put your bong away and take a second look at your charts......whilst the potential for a H & S is there, so far price is still above its 4hr 200ema, which is still rising. IMO you need a much larger fall before your suggestion becomes reality"
IF this weeks candle can close under 234.74 thus being a bearish engulfing candle in realation to the week before last then we will be starting to show some decent signs of a move down.
Ignored
Spider...it IS a h/s. I am not saying it will play out because this IS the forex mkt. But it IS a h/s with the right shoulder being at the 240.60 area.
Selling into the rt shoulder is usually a good risk : reward ratio while anticipating a NL break. ALways be ready to take profits should the price bounce off of the NL
Ignored
I can't disagree with a paricular style of trading. I remember you saying earlier that you sometimes buy/sell at what you perceive to be the peak of the second shoulder. However, Fourxtrader was confused by where the actual neckline was, not by where a good entry point to sell might be. I just wanted him to have a clear understanding of where a true H & S Neckline really was.
The weekly chart shows a nice h&s formation. What am I missing here?
Perhaps you could point out what is deficient with the NL.
Ignored
The right shoulder is not complete so there is potential there but it is not a perfect H&S like someone suggested. What happens if price continues up? In that case it never will be a H&S. Price needs to return to the NL before you can consider it one and then reach target to be perfect (in my opinion). We are no-where near that. What I normally do is put a "S?" on the right shoulder and then remove the ? when it forms.
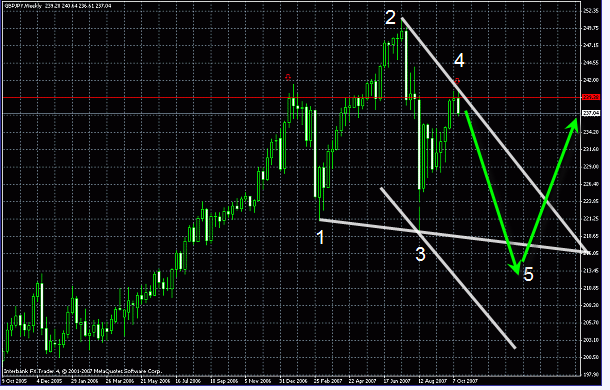
Also, I am thinking price will bounce off 221 and then continue up to 247 so the NL will not be broken (but I could be wrong).
The right shoulder is not complete so there is potential there but it is not a perfect H&S like someone suggested. What happens if price continues up? In that case it never will be a H&S. Price needs to return to the NL before you can consider it one and then reach target to be perfect (in my opinion). We are no-where near that.
Also, I am thinking price will bounce off 221 and then continue up to 247 so the NL will not be broken (but I could be wrong).
Ignored
We sure do have different opinions about h/s but that is what makes it fun. It looks to me like it is formed but that doesnt mean everyone should start to short because the trend is still up and this is a weekly chart. I tend to trade off of the 1 hr mostly but am always aware of patterns, etc on the larger time frames.But..when the price gets near the top of the rt shoulder(if it gets there), I would be careful of longs.
The right shoulder is not complete so there is potential there but it is not a perfect H&S like someone suggested. What happens if price continues up? In that case it never will be a H&S. Price needs to return to the NL before you can consider it one and then reach target to be perfect (in my opinion). We are no-where near that. What I normally do is put a "S?" on the right shoulder and then remove the ? when it forms.
Also, I am thinking price will bounce off 221 and then continue up to 247 so the NL will not be broken (but I could be wrong).
Ignored
Zoran,
Why is the rt shoulder not complete? Just curious...
|
Membership Revoked
|
Joined Sep 2007
|4,407 Posts
that a lot of times when the h/s is formed on a weekly chart it doesnt complete? (follow thru and break the NL) I was looking back on the charts and noticed that. Just wondering if I am crazy..lolol
Joined Apr 2007
|
Status: (Latin: statūs), rank, state
|3,127 Posts
Other than some internal timing , I can’t find any TA supported price levels to justify the top of the right shoulder being in place, however price has finally broken below some of the prior swing low levels, any retrace close to the top could be viewed as a good short opportunity, price breaking the support line from the end of the last bear to the end of the correction (red dashed line) should be seen as the south is on.