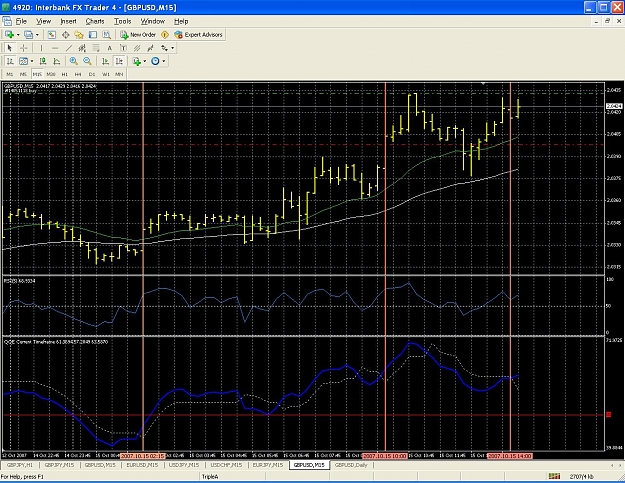
Here's the chart from Oct 11 showing the 3 short entries using this method and how they relate to the fib retracement.
The first 2 vertical gold bars show short signals that provide entry at the 38.2 fib, which should allow a target to the next 1 if not 2 fib levels below, and the 3rd bar shows the entry that would be more risky because it's the afternoon of Friday but it worked out. WHen the signal occurred the price was heading down from the 0.5 fib toward the .618, so if using fibs with this entry signal I'd be cautious of time of day and otherwise maybe wait for the .618 to break. If this trade were taken with the 30+ pip stop, it would have kept you in with a -20 at one point, then resume on to give up to +30 by end of day.
The first 2 vertical gold bars show short signals that provide entry at the 38.2 fib, which should allow a target to the next 1 if not 2 fib levels below, and the 3rd bar shows the entry that would be more risky because it's the afternoon of Friday but it worked out. WHen the signal occurred the price was heading down from the 0.5 fib toward the .618, so if using fibs with this entry signal I'd be cautious of time of day and otherwise maybe wait for the .618 to break. If this trade were taken with the 30+ pip stop, it would have kept you in with a -20 at one point, then resume on to give up to +30 by end of day.
Attached Image (click to enlarge)

"Support and Resistance either holds or it doesn't."
-Anonymous hillbilly